The cloud computing reference model

A fundamental characteristic of cloud computing is the capability to deliver, on demand, a variety of IT services that are quite diverse from each other. cloud computing services offerings into three major categories: Infrastructure-as-a-Service (IaaS), Platform-as-a-Service (PaaS), and Software-as- a-Service (SaaS). These categories are related to each other as described in Figure 1.5, which provides an organic view of cloud computing.At the base of the stack, Infrastructure-as-a-Service solutions deliver infrastructure on demand in the form of virtual hardware, storage, and networking. Virtual hardware is utilized to provide compute on demand in the form of virtual machine instances.Platform-as-a-Service solutions are the next step in the stack. They deliver scalable and elastic runtime environments on demand and host the execution of applications. These services are backed by a core middleware platform that is responsible for creating the abstract environment where applications are deployed and executed. At the top of the stack, Software-as-a-Service solutions provide applications and services on demand. Most of the common functionalities of desktop applications. Each layer provides a different service to users. IaaS solutions are sought by users who want to leverage cloud computing from building dynamically scalable computing systems requiring a spe- cific software stack. IaaS services are therefore used to develop scalable Websites or for back- ground processing.

Describe Popek and Goldberg - Cloud Computing

Popek and Goldberg provided a classification of the instruction set and proposed three theorems that define the properties that hardware instructions need to satisfy in order to efficiently support virtualization. Theorem 1: For any conventional third-generation, a VMM maybe constructed if the set of sensitive instructions for that computer is a set of privileged instructions.This theorem establishes that all the instructions that change the configuration of the system resources should generate a trap in user mode and be executed under the control of the virtual machine manager.
Theorem 2:A conventional third-generation computer is recursively if:
  1. It is virtualizable and
  2. A VMM without any timing dependencies can be constructed for it.
Recursive virtualization is the ability to run a virtual machine manager on top of another virtual machine manager. This allows nesting hypervisors as long as the capacity of the underlying resources can accommodate that. Virtualizable hardware is a prerequisite to recursive virtualization.
THEOREM 3: A hybrid VMM may be constructed for any conventional third-generation machine in which set of user-sensitive instructions is a subset of the set of privileged instructions. There is another term, hybrid virtual machine (HVM), which is less efficient than the virtual machine system. In the case of an HVM, more instructions are interpreted rather than being executed directly. All instructions in virtual supervisor mode are interpreted. Whenever there is an attempt to execute a behavior-sensitive or control-sensitive instruction, HVM controls the execution directly or gains the control via a trap. Here all sensitive instructions are caught by HVM that are simulated.

Hardware Virtualization Techniques

Operating System Level Virtualization
  • To create different and separated execution environments for applications that are managed concurrently.
  • There is no virtual machine manager or hypervisor, and the virtualization is done within a single operating system.
  • OS kernel allows for multiple isolated user space instances.
  • chroot mechanism in Unix systems. The chroot operation changes the file system root directory for a process and its children to a specific directory.
  • The process and its children cannot have access to other portions of the file system.
Programming language-level virtualization
  • To achieve ease of deployment of applications, managed execution, and portability across different platforms and operating systems.
  • It consists of a virtual machine executing the byte code of a program, which is the result of the compilation process.
  • Generally these virtual machines constitute a simplification of the underlying hardware instruction set and provide some high-level instructions that map some of the features of the languages compiled for them.
  • Basic Combined Programming Language
  • Both Java and the CLI are stack-based virtual machines.
Application-level virtualization
  • Such emulation is performed by a thin layer - a program or an operating system component that is in charge of executing the application.
  • Interpretation - In this technique every source instruction is interpreted by an emulator for executing native ISA instructions, leading to poor performance.
  • Binary translation - In this technique every source instruction is converted to native instructions with equivalent functions. After a block of instructions is translated, it is cached and reused.
  • SaaS utilizes application-level virtualization to deploy the application

Types of list in HTML (Unordered List , Ordered List , Nested Lists, Definition Lists)

Unordered Lists: The <ul> tag, which is a block tag, creates an unordered list. Each item in a list is specified with an <li> tag (li is an acronym for list item). Any tags can appear in a list item, including nested lists. When displayed, each list item is implicitly preceded by a bullet.
<html>
<head>
<title> Unordered List </title>
</head>
<body>
<h1> Some Common Single-Engine Aircraft </h1>
<ul>
<li> Cessna skyhawk</li>
<li> Beechcraft Bonaza</li>
<li> piper Cherokee</li>
</ul>
</body>
</html>
Ordered Lists: ✦ Ordered lists are lists in which the order of items is important. This orderedness of a list is shown in the display of the list by the implicit attachment of a sequential value to the beginning of each item. The default sequential values are Arabic numerals, beginning with 1. An ordered list is created within the block tag <ol>. ✦ The items are specified and displayed just as are those in unordered lists, except that the items in an ordered list are preceded by sequential values instead of bullets. <html> <head> <title> ordered List </title> </head> <body> <h3> Cessna 210 Engine Starting Instructions </h3> <ol> <li> Set mixture to rich </li> <li> Set propeller to high RPM </li> <li> Set ignition switch to "BOTH" </li> <li> Set auxiliary fuel pump switch to "LOW PRIME" </li> <li> When fuel pressure reaches 2 to 2.5 PSI, push starter button </li> </ol> </body> </html> Nested Lists: <html> <head> <title> nested lists </title> </head> <ol> <li> Information Science </li> <ol> <li>OOMD</li> <li>Java & J2ee</li> <ul> <li>classes and methods</li> <li>exceptions</li> <li>applets</li> <li>servelets</li> </ul> <li>Computer Networks</li> <ul> <li>Part 1</li> <li>Part 2</li> </ul> <li>DBMS</li> <li>Operations Research</li> </ol> <li> Computer Science</li> <ol> <li>Compiler Design</li> <li>FLAT</li> <ul> <li>NFA</li> <li>DFA</li> <li>CFG</li> </ul> <li>Computer Graphics</li> <li>Artificial Intelligence</li> </ol> </ol> </html> Definition Lists: ✦As the name implies, definition lists are used to specify lists of terms and their definitions, as in glossaries. A definition list is given as the content of a <dl> tag, which is a block tag. ✦ Each term to be defined in the definition list is given as the content of a <dt> tag. The definitions themselves are specified as the content of $lt;dd> tags. ✦ The defined terms of a definition list are usually displayed in the left margin; the definitions are usually shown indented on the line or lines following the term. <html> <head> <title> Definition List </title> </head> <body> <h3> Single-Engine Cessna Airplanes </h3> <dl > <dt> 152 </dt> <dd> Two-place trainer </dd> <dt> 172 </dt> <dd> Smaller four-place airplane </dd> <dt> 182 </dt> <dd> Larger four-place airplane </dd> <dt> 210 </dt> <dd> Six-place airplane - high performance </dd> </dl> </body> </html> luding nested lists. When displayed, each list item is implicitly preceded by a bullet. <html> <head> <title> Unordered List </title> </head> <body> <h1> Some Common Single-Engine Aircraft </h1> <ul> <li> Cessna skyhawk</li> <li> Beechcraft Bonaza</li> <li> piper Cherokee</li> </ul> </body> </html>

Tables in HTML (rowspan and colspan, align and valign, cellpadding and cellspacing, Sections)

A table is a matrix of cells. The cells in the top row often contain column labels, those in the leftmost column often contain row labels, and most of the rest of the cells contain the data of the table. The content of a cell can be almost any document element, including text, a heading, a horizontal rule, an image, and a nested table. Basic Table Tags ➤A table is specified as the content of the block tag <table>. ➤There are two kinds of lines in tables: the line around the outside of the whole table is called the border; the lines that separate the cells from each other are called rules. ➤It can be obtained using border attribute. The possible values are “border” or any number. ➤The table heading can be created using <caption> tag. ➤The table row can be created using <tr> tag. ➤The column can be created either by using <th> tag (stands for table header which is suitable for headings) or <td> tag (stands for table data which is suitable for other data).

<html>
<head>
<title> Table with text and image </title>
</head>
<body>
<table border = "border">
<caption>VTU Memo </caption>
<tr>
<th> VTU </th>
<th> Image </th>
</tr>
<tr>
<td> Funny image </td>
<td> <img src = "img(13).jpg" alt = "cant display"/></td>
</tr>
<tr>
<td> True Story </td>
<td> <img src = "img(19).jpg" alt = "cant display"/></td>
</tr>
</table>
</body>
</html>

The rowspan and colspan Attributes: Multiple-level labels can be specified with the rowspan and colspan attributes.

<html>
<head>
<title>row-span and column-span</title>
</head>
<body>
<p> Illustration of Row span</p>
<table border="border">
<tr>
<th rowspan="2"> ATME</th>
<th>ISE</th>
</tr>
<tr>
<th>CSE</th>
</tr>
</table>
<p> Illustration of Column span</p>
<table border="border">
<tr>
<th colspan="2"> ATME </th>
</tr>
<tr>
<th>ISE</th>
<th>CSE</th>
</tr>
</table>
</body>
</html>

The align and valign Attributes: ➤The placement of the content within a table cell can be specified with the align and valign attributes in the <tr>, <th>, and <td> tags. ➤The align attribute has the possible values left, right, and center, with the obvious meanings for horizontal placement of the content within a cell. ➤The default alignment for th cells is center; for td cells, it is left. The valign attribute of the <th> and <td> tags has the possible values top and bottom. ➤The default vertical alignment for both headings and data is center.

<html>
<head>
<title> Align and valign </title>
</head>
<body>
<p>Table having entries with different alignments</p>
<table border="border">
<tr align = "center">
<th> </th>
<th> Column Label </th>
<th> Another One </th>
<th> Still Another </th>
</tr>
<tr>
<th> Align </th>
<td align = "left"> Left</td>
<td align = "center"> Center </td>
<td align = "right"> right </td>
</tr>
<tr>
<th> <br/>Valign<br/><br/><br/></th>
<td> Deafult </td>
<td valign = "top"> Top</td>
<td valign = "bottom"> Bottom</td>
</tr>
</table>
</body>
</html>

The cellpadding and cellspacing Attributes: Cellspacing is the distance between cells. Cellpadding is the distance between the edges of the cell to its content.

<html>
<head>
<title> cell spacing and cell padding </title>
</head>
<body>
<h3>Table with space = 10, pad = 50</h3>
<table border = "7" cellspacing = "10" cellpadding = "50">
<tr>
<td> Kswamy</td>
<td>Chethan </td>
</tr>
</table>
<h3>Table with space = 50, pad = 10</h3>
<table border = "7" cellspacing = "50" cellpadding = "10">
<tr>
<td> Divya </td>
<td>Chethan </td>
</tr>
</table>
</body>
</html>

Table Sections: ➤ Tables naturally occur in two and sometimes three parts: header, body, and footer. (Not all tables have a natural footer.) ➤ These three parts can be respectively denoted in XHTML with the thead, tbody, and tfoot elements. ➤ The header includes the column labels, regardless of the number of levels in those labels. ➤ The body includes the data of the table, including the row labels. ➤ The footer, when it appears, sometimes has the column labels repeated after the body. ➤ In some tables, the footer contains totals for the columns of data above. ➤ A table can have multiple body sections, in which case the browser may delimit them with horizontal lines that are thicker than the rule lines within a body section.

Form in HTML

The most common way for a user to communicate information from a Web browser to the server is through a form. XHTML provides tags to generate the commonly used objects on a screen form. These objects are called controls or widgets. There are controls for single-line and multiple-line text collection, checkboxes, radio buttons, and menus, among others. All control tags are inline tags. The <form> Tag: All of the controls of a form appear in the content of a <form> tag. A block tag, <form>, can have several different attributes, only one of which, action, is required. The action attribute specifies the URL of the application on the Web server that is to be called when the user clicks the <i> Submit button</i>. Our examples of form elements will not have corresponding application programs, so the value of their action attributes will be the empty string (""). The <input> Tag: Many of the commonly used controls are specified with the inline tag <input>, including those for text, passwords, checkboxes, radio buttons, and the action buttons Reset, Submit, and plain. Text Box
  • It is a type of input which takes the text.
  • Any type of input can be created using <input>
  • The type attribute indicates what type of input is needed for the text box, the value should be given as text.
  • For any type of input, a name has to be provided which is done using name attribute.
  • The size of the text can be controlled using size attribute.
  • Every browser has a limit on the number of characters it can collect. If this limit is exceeded, the extra characters are chopped off. To prevent this chopping, maxlength attribute can be used. When maxlength is used, users can enter only those many characters that is given as a value to the attribute.

<html>
<head>
<title>Text Box</title>
</head>
<body>
<form action = " ">
<p> <label>Enter your Name:
<input type = "text" name = "myname" size = "20" maxlength = "20" />
</label> </p>
</form>
</body>
</html>
Password Box
  • If the contents of a text box should not be displayed when they are entered by the user, a password control can be used.
  • In this case, regardless of what characters are typed into the password control, only bullets or asterisks are displayed by the browser.

<html>
<head>
<title>Password Box</title>
</head>
<body>
<form action = " ">
<p> <label>Enter the email id:
<input type = "text" name = "myname" size = "24" maxlength = "25" /> </label> </p>
<p> <label>Enter the password:
<input type = "password" name = "mypass" size = "20" maxlength = "20" />
</label> </p>
</form>
</body>
</html>
Radio Button
  • Radio buttons are special type of buttons which allows the user to select only individual option
  • Radio buttons are created using the input tag with the type attribute having the value radio.
  • When radio buttons are created, values must be provided with the help of value attribute.
  • All the radio buttons which are created would have same name. This is because the radio buttons are group elements.
  • If one of the radio buttons has to be selected as soon as the web page is loaded, checked attribute should be used. The value also would be checked.

<html>
<head>
<title>Radio Button</title>
</head>
<body>
<h3>Age Category ?</h3>
<form action = " ">
<p>
<label><input type="radio" name="age" value="under20" checked = “checked”/>0-19 </label>
<label><input type="radio" name="age" value="20-35"/>20-35</label>
<label><input type="radio" name="age" value="36-50"/>36-50 </label>
<label><input type="radio" name="age" value=" over50"/>over50</label>
</p>
</form>
</body>
</html>
Check Box
  • Check box is a type of input using which multiple options can be selected.
  • Check box can also be created using the <input> tag with the type having the value “checkbox”.
  • During the creation of check box, the value should be provided using the value attribute.
  • All the checkbox which are created would have the same name because they are group elements.
  • If one of the check box have to be selected as soon as the page is loaded, checked attribute should be used with the value checked.
<html>
<head>
<title>Check Box</title>
</head>
<body>
<h3>Grocery Checklist</h3>
<form action = " ">
<p>
<label><input type="checkbox" name="groceries" value="milk" checked=”checked”/>Milk</label>
<label><input type="checkbox" name=" groceries" value="bread"/> Bread </label>
<label><input type="checkbox" name=" groceries" value="eggs"/>Eggs</label>
</p>
</form>
</body>
</html>
The <select> Tag:
  • Menu items is another type of input that can be created on the page.
  • To create the menu item, <select> tag is used.
  • To insert the item in the menu, <option> tag is used.
<html>
<head>
<title> Menu </title>
</head>
<body>
<p> ATME Branches - Information Science, Computer Science, Electronics, Electrical, Mechanical </p>
<form action = "">
<p> With size = 1 (the default)
<select name = "branches">
<option> Information Science </option>
<option> Computer Science </option>
<option> Electronics </option>
<option> Electrical </option>
<option> Mechanical </option>
</select>
</p>
</form>
</body>
</html>
If you give <select name = "branches" size = “3”>, then you will get a scroll bar instead of drop down menu. It is as shown in the output given below: The <textarea> Tag:
  • Text area is a type of input using which multiple statements can be entered.
  • Text area is created using <textarea> tag.
  • Text area should have the name.
  • During the creation of text area, it should be mentioned how many sentences can be entered. This is done using rows attribute.
  • Similarly, it should also be mentioned how many characters can be entered in a line. This is done using cols attribute.
  • If the value given to rows is exceeded i.e. if users enter sentences more than specified, the scroll bar automatically appears.

<html>
<head>
<title> text area </title>
</head>
<body>
<form action=" ">
<h3> Enter your comments</h3>
<p>
<textarea name="feedback" rows="5" cols="100">
(Be Brief and concise)
</textarea>
</p>
</form>
</body>
</html>
The Action Buttons: The Reset button clears all of the controls in the form to their initial states. The Submit button has two actions: First, the form data is encoded and sent to the server; second, the server is requested to execute the server-resident program specified in the action attribute of the <form> tag. The purpose of such a server-resident program is to process the form data and return some response to the user. Every form requires a Submit button. The Submit and Reset buttons are created with the <input> tag.
<html>
<head>
<title> action buttons </title>
</head>
<body>
<form action=" ">
<p>
<input type="SUBMIT" value="SUBMIT"/>
<input type="RESET" value="RESET"/>
</p>
</form>
</body>
</html>
Example of a Complete Form:

<html>
<head>
<title> CompleteForm</title>
</head> <body>
<h1>Registration Form</h1>
<form action=" ">
<p> <label>Enter your email id:
<input type = "text" name = "myname" size = "24" maxlength = "25" />
</label> </p>
<p> <label>Enter the password:
<input type = "password" name = "mypass" size = "20" maxlength = "20" />
</label> </p>
<p>Sex</p>
<p>
<label><input type="radio" name="act" value="one"/>Male</label>
<label><input type="radio" name="act" value="two"/>Female</label>
</p>
<p>Which of the following Accounts do you have?</p>
<p>
<label><input type="checkbox" name="act" value="one"/>Gmail</label>
<label><input type="checkbox" name="act" value="two"/>Facebook</label>
<label><input type="checkbox" name="act" value="three"/>Twitter</label>
<label><input type="checkbox" name="act" value="four"/>Google+</label>
</p>
<p> Any Suggestions?</p>
<p> <textarea name="feedback" rows="5" cols="100"> </textarea> </p>
<p>Click on Submit if you want to register</p>
<p> <input type="SUBMIT" value="SUBMIT"/>
<input type="RESET" value="RESET"/>
</p>
</form>
</body>
</html>

Explain the SIC machine architecture in detail.

Memory: ⦿ Memory consists of 8-bit bytes; any 3 consecutive bytes form a word (24 bits). All addresses on SIC are byte addresses ⦿ Words are addressed by the location of their lowest numbered byte. ⦿ There are total of 32,768 (215) bytes in the computer memory. Registers: There are five registers, all of which have special uses. Each register is 24 bits in length. Their mnemonics, numbers and uses are given in the following table.

Mnemonic	Number	Special Use
A	0	Accumulator; used for arithmetic operations
X	1	Index register; used for addressing
L	2	Linkage register; JSUB instruction stores the return address in this register
PC	8	Program counter; contains the address of the next instruction to be fetched for execution.
SW	9	Status word; contains a variety of information, including a Condition Code (CC)

Data Formats: ⦿Integers are stored as 24-bit binary numbers. ⦿2’s complement representation is used for negative values. ⦿characters are stored using their 8-bit ASCII codes. ⦿There is no floating-point hardware on the standard version of SIC. Instruction Formats: All machine instructions on the standard version of SIC have the 24-bit format:

8	       1	           15
opcode	       x	           Address
Addressing Modes: There are two addressing modes available, indicated by the setting of the x bit in the instruction.

Mode	Indication	Target Address Calculation
Direct	x=0	TA= address
Indexed	x=1	TA= address + (X)

Parentheses are used to indicate the contents of a register or a memory location. For example, (X) represents the contents of register X. Direct Addressing Mode:

 Example: LDA     TEN		LDA – 00
 opcode	  x	                                 TEN
 0 0 0 0   0 0 0 0	  0	        0 0 1    0 0 0 0    0 0 0 0    0 0 0 0
 Effective Address (EA) = 1000
 Content of the address 1000 is loaded to Accumulator.
 
 
Indexed Addressing Mode: Example: STCH BUFFER, X
 
 opcode	  x	                          BUFFER
 0 0 0 0   0 1 0 0	  1	        0 0 1    0 0 0 0    0 0 0 0    0 0 0 0
Effective Address (EA) = 1000 + [X] = 1000 + content of the index register X The Accumulator content, the character is loaded to the Effective address. Instruction Set: SIC provides, load and store instructions (LDA, LDX, STA, STX, etc.). Integer arithmetic operations: (ADD, SUB, MUL, DIV, etc.). All arithmetic operations involve register A and a word in memory, with the result being left in the register. Two instructions are provided for subroutine linkage. COMP compares the value in register A with a word in memory, this instruction sets a condition code CC to indicate the result. There are conditional jump instructions: (JLT, JEQ, JGT), these instructions test the setting of CC and jump accordingly. JSUB jumps to the subroutine placing the return address in register L, RSUB returns by jumping to the address contained in register L. Input and Output: Input and Output are performed by transferring 1 byte at a time to or from the rightmost 8 bits of register A (accumulator). The Test Device (TD) instruction tests whether the addressed device is ready to send or receive a byte of data. Read Data (RD), Write Data (WD) are used for reading or writing the data.

What are the Different types of assemblers and Explain the features used in assemblers

Machine-Dependent Assembler Features: ➜Instruction formats and addressing modes ➜Program relocation. Instruction formats and Addressing Modes The instruction formats depend on the memory organization and the size of the memory. In SIC machine the memory is byte addressable. Word size is 3 bytes. So the size of the memory is 2^12 bytes. Accordingly it supports only one instruction format. It has only two registers: register A and Index register. Therefore the addressing modes supported by this architecture are direct, indirect, and indexed. Whereas the memory of a SIC/XE machine is. 220 bytes (1 MB). This supports four different types of instruction types, they are:   1 byte instruction   2 byte instruction   3 byte instruction   4 byte instruction Instructions can be: –-- Instructions involving register to register –-- Instructions with one operand in memory, the other in Accumulator (Single operand instruction) --– Extended instruction format Addressing Modes are: –-- Index Addressing(SIC): Opcode m, x –-- Indirect Addressing: Opcode @m –-- PC-relative: Opcode m --– Base relative: Opcode m –-- Immediate addressing: Opcode #c Translations for the Instruction involving Register-Register addressing mode: During pass 1 the registers can be entered as part of the symbol table itself. The value for these registers is their equivalent numeric codes. During pass2, these values are assembled along with the mnemonics object code. If required a separate table can be created with the register names and their equivalent numeric values. Translation involving Register-Memory instructions: In SIC/XE machine there are four instruction formats and five addressing modes. For formats and addressing modes. Among the instruction formats, format -3 and format-4 instructions are Register-Memory type of instruction. Program relocation ➜The actual starting address of the program is not known until load time ➜An object program that contains the information necessary to perform this kind of modification is called a relocatable program ➜No modification is needed: operand is using program-counter relative or base relative addressing ➜The only parts of the program that require modification at load time are those that specified direct (as opposed to relative) addresses ➜Modification record  ⦿Col. 2-7 Starting location of the address field to be modified, relative to the beginning of the program (Hex) ➜Col. 8-9 Length of the address field to be modified, in half-bytes (Hex) Machine independent assembler feature: Literals Symbol-defining statements Expressions Program block Control sections and program linking Literals   Write the value of a constant operand as a part of the instruction that uses it Such an operand is called a literal   Avoid having to define the constant elsewhere in the program and make up a label for it   A literal is identified with the prefix =, which is followed by a specification of the literal value   Examples of literals in the statements:

o45	001A	ENDFIL	LDA	=C’EOF’    032010
o215	1062	WLOOP	TD	=X’05’	   E32011 
  With a literal, the assembler generates the specified value as a constant at some other memory location   The address of this generated constant is used as the target address for the machine instruction   All of the literal operands used in the program are gathered together into one or more literal pools   Normally literals are placed into a pool at the end of the program   A LTORG statement creates a literal pool that contains all of the literal operands used since the previous LTORG   Most assembler recognize duplicate literals: the same literal used in more than one place and store only one copy of the specified data value   LITTAB (literal table): contains the literal name, the operand value and length, and the address assigned to the operand when it is placed in a literal pool Expressions  Assembler allow arithmetic expressions formed according to the normal rules using the operator +, -, *, and /  Individual terms in the expression may be constants, user-defined symbols, or special terms  The most common such special term is the current value of the location counter (designed by *)  Expressions are classified as either absolute expressions or relative expressions Program Block  Program blocks: segments of code that are rearranged within a single object unit  Control sections: segments that are translated into independent object program units  USE indicates which portions of the source program belong to the various blocks Control section  References between control sections are called external references  The assembler generates information for each external reference that will allow the loader to perform the required linking  The EXTDEF (external definition) statement in a control section names symbol, called external symbols, that are define in this section and may be used by other sections  The EXTREF (external reference) statement names symbols that are used in this control section and are defined elsewhere Define record (D) ⦿  Col. 2-7 Name of external symbol defined in this control section ⦿  Col. 8-13 Relative address of symbol within this control section (Hex) ⦿  Col. 14-73 Repeat information in Col. 2-13 for other external symbols Refer record (R) ⦿  Col. 2-7 Name of external symbol referred to in this control section ⦿  Col. 8-73 Names of other external reference symbols Modification record (revised : M) ⦿  Col. 2-7 Starting address of the field to be modified, relative to the beginning of the control section (Hex) ⦿  Col. 8-9 Length of the field to be modified, in half-bytes (Hex) ⦿  Col. 10 Modification flag (+ or -) ⦿  Col. 11-16 External symbol whose value is to be added to or subtracted from the indicated field

What is Program Relocation? Explain the problem associated with it and there solution

Program relocation


Ø The actual starting address of the program is not known until load time


Ø An object program that contains the information necessary to perform this kind of modification is called a relocatable program


Ø No modification is needed: operand is using program-counter relative or base relative addressing


Ø The only parts of the program that require modification at load time are those that specified direct (as opposed to relative) addresses


Ø Modification record


        o Col. 2-7 Starting location of the address field to be modified, relative to the           beginning of the program (Hex)


Col. 8-9  Length of the address field to be modified, in half-bytes (Hex)


Sometimes it is required to load and run several programs at the same time. The system must be able to load these programs wherever there is place in the memory. Therefore the exact starting is not known until the load time.


Absolute Program


In this the address is mentioned during assembling itself. This is called Absolute Assembly.


Consider the instruction:


55101B  LDA   THREE    00102D


· This statement says that the register A is loaded with the value stored at location 102D. Suppose it is decided to load and execute the program at location 2000 instead of location 1000.


· Then at address 102D the required value which needs to be loaded in the register A is no more available. The address also gets changed relative to the displacement


of the program. Hence we need to make some changes in the address portion of the instruction so that we can load and execute the program at location 2000.


· Apart from the instruction which will undergo a change in their operand address value as the program load address changes. There exist some parts in the program which will remain same regardless of where the program is being loaded.


· Since assembler will not know actual location where the program will get loaded, it cannot make the necessary changes in the addresses used in the program. However, the assembler identifies for the loader those parts of the program which need modification.


· An object program that has the information necessary to perform this kind of modification is called the relocatable program.

Give the algorithm for pass1 of and 2 pass assembler

 The Algorithm for Pass 1:


Begin

read first input line

if OPCODE = ‘START’ then begin

save #[Operand] as starting addr

initialize LOCCTR to starting address

write line to intermediate file

read next line

end( if START)


      Else
initialize LOCCTR to 0
While OPCODE != ‘END’ do
Begin
if this is not a comment line then
Begin
if there is a symbol in the LABEL field then
Begin
search SYMTAB for LABEL
if found then
set error flag (duplicate symbol)
Else
(if symbol)
search OPTAB for OPCODE
if found then
add 3 (instr length) to LOCCTR
else if OPCODE = ‘WORD’ then
add 3 to LOCCTR
else if OPCODE = ‘RESW’ then
add 3 * #[OPERAND] to LOCCTR
else if OPCODE = ‘RESB’ then


add #[OPERAND] to LOCCTR

else if OPCODE = ‘BYTE’ then

begin

find length of constant in bytes

add length to LOCCTR

end

else

set error flag (invalid operation code)

end (if not a comment)

write line to intermediate file

read next input line

end { while not END}

write last line to intermediate file

Save (LOCCTR – starting address) as program length

End {pass 1}


The Algorithm for Pass 2:


Begin

read 1st input  line

if OPCODE = ‘START’ then

begin

write listing line

read next input line

end

write Header record to object program

initialize 1st Text record

while OPCODE != ‘END’ do

begin

if this is not comment line then

begin


search OPTAB for OPCODE
if found then
Begin
if there is a symbol in OPERAND field then
Begin
search SYMTAB for OPERAND field then
if found then
Begin
store symbol value as operand address
Else
Begin
store 0 as operand address
set error flag (undefined symbol)
End
end (if symbol)
else store 0 as operand address
assemble the object code instruction
else if OPCODE = ‘BYTE’ or ‘WORD” then
convert constant to object code
if object code doesn’t fit into current Text record then
Begin


Write text record to object code

initialize new Text record

end

add object code to Text record

end {if not comment}

write listing line

read next input line

end

write listing line

read next input line

write last listing line

End {Pass 2}

Explain with a neat diagram phases of a compiler by taking an example A=B+C*60.

 1) Lexical Analyzer

— The first phase of compiler is lexical analyzer it reads stream of characters in the source program

— Groups the characters into meaningful sequences – lexemes

— For each lexeme, a token is produced as output

—  <token-name , attribute-value>

Token-name : symbol used during syntax analysis

Attribute-value : an entry in the symbol table for this token

— Information from symbol table is needed for syntax analysis and code generation

— Consider the following assignment statement 

2) Syntax Analysis

The second phase of compiler is  syntax analysis  is also  called Parsing

— Parser uses the tokens to create a tree-like intermediate representation

— Depicts the grammatical structure of the token stream

— Syntax tree is one such representation

                                 Interior node – operation

                                 Children  - arguments of the operation

Other phases use this syntax tree to help analyze source program and generate target program


3) Semantic Analysis

The third phase of compiler is Semantic Analyzer

— Checks semantic consistency with language using:

                               Syntax tree  and Information in symbol table

— Gathers type information and save in syntax tree or symbol table

— Type Checks each operator for matching operands

                               Ex: Report error if floating point number is used as index of an array

— Coercions or type conversions

                         Binary arithmetic operator applied to a pair of integers or floating point numbers

                           If applied to floating point and integer, compiler may convert integer to floating-

                            point number


4) Intermediate Code Generation

     After syntax and semantic analysis  Intermediate Code Generation is the fourth  phase of compiler

— Compilers generate machine-like intermediate representation

— This intermediate representation should have the two properties:

                         Should be easy to produce

                         Should be easy to translate into target machine

             Three-address code

— Sequence of assembly-like instructions with three operands per instruction

— Each operand acts like a register

                        Points to be noted about three-address instructions are:

— Each assignment instruction has at most one operator on the right side

— Compiler must generate a temporary name to hold the value computed by a three-address instruction

— Some instructions have fewer than three operands


5) Code Optimization

            Attempt to improve the target code

— Faster code, shorter code or target code that consumes less power

                        Optimizer can deduce that

— Conversion of 60 from int to float can be done once  at compile time

— So, the inttofloat can be eliminated by replacing 60 with 60.0

 t3 is used only once to transmit its value to id1


6) Code Generation

— Takes intermediate representation as input

— Maps it into target language

— If target language is machine code

                        Registers or memory locations are selected for each of the variables used

                        Intermediate instructions are translated into sequences of machine instructions

                        performing the same task

— Assignment of registers to hold variables is a crucial aspect

Discuss the various applications of compiler technology

 Applications of Compiler Technology

1. Implementation of high-level programming languages

Ø High-level programming language defines a programming abstraction
Ø Low-level language have more control over computation and produce efficient code
Ø Hard to write, less portable, prone to errors and harder to maintain
Ø Example : register  keyword
Ø Common programming languages (C, Fortran, Cobol) support
Ø User-defined aggregate data types (arrays, structures, control flow )
Ø Data-flow optimizations
Ø Analyze flow of data through the program and remove redundancies
Ø Key ideas behind object oriented languages are Data Abstraction
      and Inheritance of properties
Ø Java has features that make programming easier
Ø Type-safe – an object cannot be used as an object of an unrelated type
Ø Array accesses are checked to ensure that they lie within the bounds
Ø Built in garbage-collection facility
Ø Optimizations developed to overcome the overhead by eliminating unnecessary range checks
2. Optimizations for Computer Architectures

Ø Parallelism
Ø Instruction level : multiple operations are executed simultaneously
Ø Processor level : different threads of the same application run on different processors
Ø Memory hierarchies
Ø Consists of several levels of storage with different speeds and sizes
Ø Average memory access time is reduces
Ø Using registers effectively is the most important problem in optimizing a program
Ø Caches and physical memories are managed by the hardware
Ø Improve effectiveness by changing the layout of data or order of instructions accessing the data
3. Design of new Computer Architectures

Ø RISC (Reduced Instruction-Set Computer)
Ø CISC (Complex Instruction-Set Computer)
Ø Make assembly programming easier
Ø Include complex memory addressing modes
Ø Optimizations reduce these instructions to a small number of simpler operations
Ø PowerPC, SPARC, MIPS, Alpha and PA-RISC
Ø Specialized Architectures
Ø Data flow machines, vector machines, VLIW, SIMD, systolic arrays
Ø Made way into the designs of embedded machines
Ø Entire systems can fit on a single chip
Ø Compiler technology helps to evaluate architectural designs
4. Program Translations
Ø Binary Translation
Ø Translate binary code of one machine to that of another
Ø Allow machine to run programs compiled for another instruction set
Ø Used to increase the availability of software for their machines
Ø Can provide backward compatibility
Ø Hardware synthesis
Ø Hardware designs are described in high-level hardware description languages like Verilog and VHDL
Ø Described at register transfer level (RTL)
Ø Variables represent registers
Ø Expressions represent combinational logic
Ø Tools translate RTL descriptions into gates, which are then mapped to transistors and eventually to physical layout
Ø Database Query Interpreters
Ø Languages are useful in other applications
Ø Query languages like SQL are used to search databases
Ø Queries consist of predicates containing relational and boolean operators
Ø Can be interpreted or compiled into commands to search a database
Ø Compiled Simulation
Ø Simulation Technique used in scientific and engg disciplines,Understand a phenomenon or validate a design
Ø Inputs include description of the design and specific input parameters for that run
5. Software Productivity Tools
Ø Testing is a primary technique for locating errors in a program
Ø Use data flow analysis to locate errors statically
Ø Problem of finding all program errors is undecidable
Ø Ways in which program analysis has improved software productivity
Ø Type Checking
Ø Catch inconsistencies in the program
Ø Operation applied to wrong type of object
Ø Parameters to a procedure do not match the signature
Ø Go beyond finding type errors by analyzing flow of data
Ø If pointer is assigned null and then dereferenced, the program is clearly in error
Ø Bounds Checking
Ø Security breaches are caused by buffer overflows in programs written in C
Ø Data-flow analysis can be used to locate buffer overflows
Ø Failing to identify a buffer overflow may compromise the security of the system
Ø Memory-management tools
Ø Automatic memory management removes all memory-management errors like memory leaks
Tools developed to help programmers find memory management errors

Basic concepts (features) of Object-Oriented Programming C++

Following are the features or basic concepts of C++ programming language. 1. Objects and Classes 2. Data abstraction 3. Data encapsulation 4. Inheritance 5. Polymorphism 6. Binding 7. Message passing 1. Objects and Classes: Classes are user-defined data types on which objects are created. Objects with similar properties and methods are grouped together to form a class. So class is a collection of objects. The object is an instance of a class. 2. Data abstraction Abstraction refers to the act of representing essential features without including the background details or explanation. READ How to use Constructors and their Types in C++ Example: Let’s take one real life example of a TV, which you can turn on and off, change the channel, adjust the volume, and add external components such as speakers, VCRs, and DVD players, BUT you do not know its internal details, that is, you do not know how it receives signals over the air or through a cable, how it translates them, and finally displays them on the screen. Example Data abstraction:

#include <iostream>

Using namespace std;

int main( )

{

cout << “Hello C++” <<endl;

return 0;

}
Here, you don’t need to understand how cout displays the text on the user’s screen. You need to only know the public interface and the underlying implementation of cout is free to change. 3. Data encapsulation Information hiding, Wrapping (combining) of data and functions into a single unit (class) is known as data encapsulation. READ C++ Video Tutorial Data is not accessible to the outside world, only those functions which are wrapped in the class can access it. 4. Inheritance Inheritance is the process of deriving a new class from an existing class. Existing class is known as base, parent or super class. The new class that is formed is called derived class, child or sub class. Derived class has all the features of the base class plus it has some extra features also. Writing reusable code. Objects can inherit characteristics from other objects. 5. Polymorphism The dictionary meaning of polymorphism is “having multiple forms” or Ability to take more than one form. A single name can have multiple meanings depending on its context. It includes function overloading, operator overloading. 6. Binding
Binding means connecting the function call to the function code to be executed in response to the call. READ C++ program to get and display employee details Static binding means that the code associated with the function call is linked at compile time. Also known as early binding or compile time polymorphism. Dynamic binding means that the code associated with the function call is linked at runtime. Also known as late binding or runtime polymorphism. 7. Message passing Objects communicate with one another by sending and receiving information.

How to use Constructors and their Types in C++

Defination of constructor: Constructors are special class functions which performs initialization of every object. The Compiler calls the Constructor whenever an object is created. Constructor’s initialize values to data members after storage is allocated to the object. While defining a constructor you must remember that the name of constructor will be same as the name of the class, and constructors never have return type. Constructors can be defined either inside the class definition or outside class definition using class name and scope resolution :: operator. Constructors are of four types : 1. Default Constructor 2. Parameterized Constructor 3. Copy Constructor 4. Explicit Constructor 1. Default Constructor in C++ Default constructor is the constructor which doesn’t take any argument. It has no parameters in default constructors Syntax : class_name () { Constructor Definition } Following program demonstrates the default constructor:

#include<iostream>
 using namespace std;
 class areaRect
 {
     private:
         int h, w;
     public:
     areaRect()
     {
         h = 0;
         w = 0;
     }
     int area()
    {
     cout<<"Enter the height of rectangle: ";
     cin>>h;
     cout<<"Enter the width of the rectangle: ";
     cin>>w;
     return h*w;
   }
 };
 int main()
 {
     int result;
     areaRect a1;
     result = a1.area();
     cout <<endl<<"Area of Rectangle is: "<<result;
 }
Output: Area of Rectangle is: 0 2. Parameterized Constructor in C++ These are the constructors with parameters. Using this Constructor you can provide different values to data members of different objects, by passing the appropriate values as an argument. Syntax : class_name () { Constructor Definition } Following program demonstrates the parameterized constructor:

#include<iostream>
 using namespace std;
 class areaRect
 {
     private:  int h, w;
     public:
     areaRect()
     {
         h = 0;
         w = 0;
     }
     areaRect(int x, int y)
     {
         h = x;
         w = y;
     }
     int area()
     {
         return h*w;
     }
 };
 int main()
 {
     int result;
     areaRect a1;
     result = a1.area();
     cout <<endl<<"Area of Rectangle is: "<<result;
     areaRect a2(10, 20);
    result = a2.area();
    cout <<endl<<"Area of Rectangle is: "<<result;
 }    
Output: READ C++ program to read and print Student information Area of Rectangle is: 0 Area of Rectangle is: 200 3. Copy Constructor in C++ Copy constructor is a special type of constructor in which new object is created as a copy of an existing object. The copy constructor is called whenever a new variable is created from an object. Syntax : class_name (class_name &obj) { Constructor Definition } Following program demonstrates the copy constructor:

#include<iostream>
 using namespace std;
 class areaRect
 {
     private:  int h, w;
     public:
     areaRect()
     {
         h = 10;
         w = 10;
     }
     areaRect(areaRect &obj)
     {
         h = obj.h;
         w = obj.w;
     }
     int area()
     {
         return h*w;
     }
 };
 int main()
 {
     int result;
     areaRect a1;
     result = a1.area();
     cout <<endl<<"Area of Rectangle is: "<<result;
   areaRect a2(a1);
    result = a2.area(); 
    cout <<endl<<"Area of Rectangle is: "<<result;
 }    
Output: Area of Rectangle is: 100 Area of Rectangle is: 100 4. Explicit Constructor in C++ In C++, compiler is allowed to make one time type conversion to resolve the parameters to functions. READ Friend function in C++ with Programming example In C++, a constructor with only one required parameter is considered as an implicit conversion function. It converts the parameter type to the class type. Prefixing explicit keyword prevents the constructor from using the implicit conversion. Syntax : explicit class_name (parameters) { Constructor Definition } Following program demonstrates the explicit constructor:

#include<iostream>
 using namespace std;
 class test
 {
     private:   
        int val;
     public: explicit test(int x)
    {
     val = x;
  }
  void display()
  {
        cout <<"The value of val is "<<val;
   }
 };
 int main()
 {
     test t1=10;
     t1.display();
 }
Output: The value of val is 10.

Explain Positioning Elements in CSS?
(or)
Explain the different ways of position Elements In CSS layout techniques

The position property in CSS tells about the method of positioning for an element or an HTML entity. There are five different types of position property available in CSS: 1-> Fixed 2-> Static 3-> Relative 4-> Absolute 5-> Sticky The positioning of an element can be done using the top, right, bottom and left property. These specify the distance of an HTML element from the edge of the viewport. To set the position by these four properties, we have to declare the positioning method. Types of positioning methods in details: 1. Fixed Any HTML element with position: fixed property will be positioned relative to the viewport. An element with fixed positioning allows it to remain at the same position even we scroll the page. We can set the position of the element using the top, right, bottom, left.

<!-->html code<-->
<body>
	<div class="fixed">This div has <span>position: fixed;</span></div>
	<pre>
			Lorem ipsum dolor sits amet, consectetur adipiscing elit.
			Nunc eget mauris at urna hendrerit iaculis sit amet et ipsum.
			Maecenas nec mi eget leo malesuada vehicula.
			Nam eget velit maximus, elementum ante pretium, aliquet felis.
			Aliquam quis turpis laoreet, porttitor lacus at, posuere massa.
	</pre>
</body>

// css code
body
{
	margin: 0;
	padding: 20px;
	font-family: sans-serif;
	background: #efefef;
}

.fixed
{
	position: fixed;
	background: #cc0000;
	color: #ffffff;
	padding: 30px;
	top: 50;
	left: 10;
}

span
{
	padding: 5px;
	border: 1px #ffffff dotted;
}
2. Static This method of positioning is set by default. If we don’t mention the method of positioning for any element, the element has the position:static method by default. By defining Static, the top, right, bottom and left will not have any control over the element. The element will be positioned with the normal flow of the page.

<!-->html code<-->
<body>
	<div class="static">This div has <span>position: static;</span></div>
	<pre>
			Lorem ipsum dolor sits amet, consectetur adipiscing elit.
			Nunc eget mauris at urna hendrerit iaculis sit amet et ipsum.
			Maecenas nec mi eget leo malesuada vehicula.
			Nam eget velit maximus, elementum ante pretium, aliquet felis.
			Aliquam quis turpis laoreet, porttitor lacus at, posuere massa.
	</pre>
</body>
CSS code :-

// css code
body
{
	margin: 0;
	padding: 20px;
	font-family: sans-serif;
	background: #efefef;
}

.static
{
	position: static;
	background: #cc0000;
	color: #ffffff;
	padding: 30px;
}

span
{
	padding: 5px;
	border: 1px #ffffff dotted;
}
3. Relative An element with position: relative is positioned relatively with the other elements which are sitting at top of it. If we set its top, right, bottom or left, other elements will not fill up the gap left by this element.

<!-->html code<-->
<body>
	<div class="relative">This div has
		<span>position: relative;</span></div>
	<pre>
			Lorem ipsum dolor sits amet, consectetur adipiscing elit.
			Nunc eget mauris at urna hendrerit iaculis sit amet et ipsum.
			Maecenas nec mi eget leo malesuada vehicula.
			Nam eget velit maximus, elementum ante pretium, aliquet felis.
			Aliquam quis turpis laoreet, porttitor lacus at, posuere massa.
	</pre>
</body>

// css code
body
{
	margin: 0;
	padding: 20px;
	font-family: sans-serif;
	background: #efefef;
}

.relative
{
	position: relative;
	background: #cc0000;
	color: #ffffff;
	padding: 30px;
}

span
{
	padding: 5px;
	border: 1px #ffffff dotted;
}
4. Absolute An element with position: absolute will be positioned with respect to its parent. Positioning of this element does not depend upon its siblings or the elements which are at same level.

<!-->html code<-->
<body>
	<pre>
		Lorem ipsum dolor sits amet, consectetur adipiscing elit.
		Nunc eget mauris at urna hendrerit iaculis sit amet et ipsum.
		Maecenas nec mi eget leo malesuada vehicula.
		<div class="relative">
			<p>This div has <span><strong>position: relative;</strong>
														</span></p>
			<div class="absolute">
			This div has <span><strong>position:
							absolute;</strong></span>
			</div>
		</div>
		Nam eget velit maximus, elementum ante pretium, aliquet felis.
		Aliquam quis turpis laoreet, porttitor lacus at, posuere massa.
	</pre>
</body>

// css code
body
{
	margin: 0;
	padding: 20px;
	font-family: sans-serif;
	background: #efefef;
}

.absolute
{
	position: absolute ;
	background: #cc0000;
	color: #ffffff;
	padding: 30px;
	font-size: 15px;
	bottom: 20px;
	right: 20px;
}

.relative
{
	position: relative;
	background: #aad000;
	height: 300px;
	font-size: 30px;
	border: 1px solid #121212;
	text-align: center;
}

span
{
	padding: 5px;
	border: 1px #ffffff dotted;
}

pre
{
	padding: 20px;
	border: 1px solid #000000;
}
5. Sticky Element with position: sticky and top: 0 played a role between fixed & relative based on the position where it is placed. If the element is placed at the middle of the document then when user scrolls the document, the sticky element starts scrolling until it touch the top. When it touches the top, it will be fixed at that place inspite of further scrolling. We can stick the element at bottom, with the bottom property.

<!-->html code<-->
<body>
     <pre>
        Lorem ipsum dolor sits amet, consectetur adipiscing elit.
        Nunc eget mauris at urna hendrerit iaculis sit amet et ipsum.
        Maecenas nec mi eget leo malesuada vehicula.
                <div class="sticky">
                     This div has <span>position: sticky;</span>
                </div>
        Nam eget velit maximus, elementum ante pretium, aliquet felis.
        Aliquam quis turpis laoreet, porttitor lacus at, posuere massa.
     </pre>
</body>
Below is the CSS code to illustrate the sticky property:

// css code
body
{
    margin: 0;
    padding: 20px;
    font-family: sans-serif;
    background: #efefef;
}
  
.sticky
{
    position: sticky;
    background: #cc0000;
    color: #ffffff;
    padding: 30px;
        top: 10px;
        right: 50px;
}
  
span
{
    padding: 5px;
    border: 1px #ffffff dotted;
}
  
pre
{
       padding: 20px;
       border: 1px solid #000000;
}

Approaches to CSS Layout .
Explain fixed Layout and Liquid Layout with example each. List liquid and Fixed layout Advantages and limitations.

APPROACHES TO CSS LAYOUT One of the main problems faced by web designers is that the size of the screen used to view the page can vary quite a bit. Most designers take one of two basic approaches to dealing with the problems of screen size. While there are other approaches than these two, the others are really just enhancements to these two basic models. 1 FIXED LAYOUT • The first approach is to use a fixed layout. In a fixed layout, the basic width of the design is set by the designer, typically corresponding to an “ideal” width based on a “typical” monitor resolution. • A common width used is something in the 960 to 1000 pixel range, which fits nicely in the common desktop monitor resolution (1024 × 768). This content can then be positioned on the left or the center of the monitor. • Fixed layouts are created using pixel units, typically with the entire content within a <div> container (often named "container", "main", or "wrapper") whose width property has been set to some width, as shown in Figure. • The advantage of a fixed layout is that it is easier to produce and generally has a predictable visual result. It is also optimized for typical desktop monitors; however, as more and more user visits are happening via smaller mobile devices, this advantage might now seem to some as a disadvantage. • Fixed layouts have other drawbacks. For larger screens, there may be an excessive amount of blank space to the left and/or right of the content. Much worse is when the browser window shrinks below the fixed width; the user will have to horizontally scroll to see all the content, as shown in Figure 2 LIQUID LAYOUT • The second approach to dealing with the problem of multiple screen sizes is to use a liquid layout (also called a fluid layout). In this approach, widths are not specified using pixels, but percentage values.Percentage values in CSS are a percentage of the current browser width, so a layout in which all widths are expressed as percentages should adapt to any browser size, as shown in Figure 5.29. • The obvious advantage of a liquid layout is that it adapts to different browser sizes, so there is neither wasted white space nor any need for horizontal scrolling. Advantages and Limitations of Fluid/Liquid Layout Advantages in certain situations can be constrained with max width, min width property, does not include padding borders or margin, Max height and min height does not include padding, borders, or margin By using a mixture of width, height, overflow, and max, min we can take control of both fixed width, fluid and fixed/fluid layouts Pros/Benifits -Fluid can be more user friendly because it adjusts to the users set up. -If designed well can eliminate horizontal scroll bars that appear on small screen sizes. -Also with wider screens more or all of the content will appear on the screen above the fold and so there may be no need for vertical scrolling at all. Cons/Limitations -The designer has less control over what the user sees -Elements that usually have a fixed width such as images, video may have to be set at multiple widths to accommodate different screen sizes. -Lack of content on large screen sizes may create a lot of white space and long unreadable paragraph lines.
Advantages and disadvantages of fixed Layout ----- These are the advantages of fixed-width design: ----- -The basic layout of the page remains the same regardless of canvas size. This may be a priority for companies interested in presenting a consistent corporate image for every visitor. -Fixed-width pages and columns provide better control over line lengths, preventing them from becoming too long when the page is viewed on a large monitor. ---- disadvantages ---- -If the available browser window is smaller than the grid for the page, parts of the page will not be visible and may require horizontal scrolling to be viewed. Horizontal scrolling is a hindrance to ease of use, so it should be avoided. (One solution is to choose a page size that serves the most people, as discussed later in this section.) -Elements may shift unpredictably if the font size in the browser is larger or smaller than the font size used in the design process. -Trying to exert absolute control over the display of a web page is bucking the medium. The Web is not like print; it has its own peculiarities and strengths.

Structure of a Compiler Design - Phases of Compiler

The compilation process is a sequence of various phases. Each phase takes input from its previous stage, has its own representation of source program, and feeds its output to the next phase of the compiler. Let us understand the phases of a compiler.
Lexical Analysis The first phase of scanner works as a text scanner. This phase scans the source code as a stream of characters and converts it into meaningful lexemes. Lexical analyzer represents these lexemes in the form of tokens as:

<token-name, attribute-value> 

Syntax Analysis The next phase is called the syntax analysis or parsing. It takes the token produced by lexical analysis as input and generates a parse tree (or syntax tree). In this phase, token arrangements are checked against the source code grammar, i.e. the parser checks if the expression made by the tokens is syntactically correct.
Semantic Analysis Semantic analysis checks whether the parse tree constructed follows the rules of language. For example, assignment of values is between compatible data types, and adding string to an integer. Also, the semantic analyzer keeps track of identifiers, their types and expressions; whether identifiers are declared before use or not etc. The semantic analyzer produces an annotated syntax tree as an output.
Intermediate Code Generation After semantic analysis the compiler generates an intermediate code of the source code for the target machine. It represents a program for some abstract machine. It is in between the high-level language and the machine language. This intermediate code should be generated in such a way that it makes it easier to be translated into the target machine code.
Code Optimization The next phase does code optimization of the intermediate code. Optimization can be assumed as something that removes unnecessary code lines, and arranges the sequence of statements in order to speed up the program execution without wasting resources (CPU, memory).
Code Generation In this phase, the code generator takes the optimized representation of the intermediate code and maps it to the target machine language. The code generator translates the intermediate code into a sequence of (generally) re-locatable machine code. Sequence of instructions of machine code performs the task as the intermediate code would do.
Symbol Table It is a data-structure maintained throughout all the phases of a compiler. All the identifier's names along with their types are stored here. The symbol table makes it easier for the compiler to quickly search the identifier record and retrieve it. The symbol table is also used for scope management.

Input Buffering in Compiler Design

The lexical analyzer scans the input from left to right one character at a time. It uses two pointers begin ptr(bp) and forward to keep track of the pointer of the input scanned.
Initially both the pointers point to the first character of the input string as shown below 
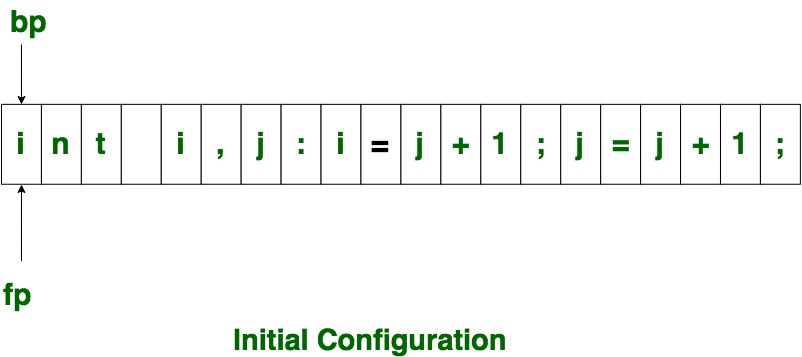
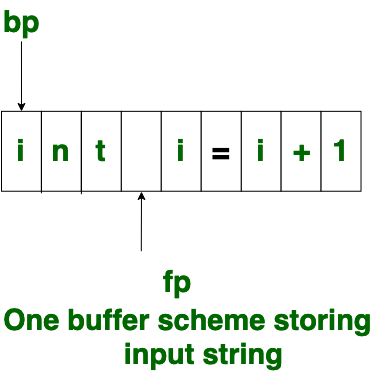
The forward ptr moves ahead to search for end of lexeme. As soon as the blank space is encountered, it indicates end of lexeme. In above example as soon as ptr (fp) encounters a blank space the lexeme “int” is identified. The fp will be moved ahead at white space, when fp encounters white space, it ignore and moves ahead. then both the begin ptr(bp) and forward ptr(fp) are set at next token. 
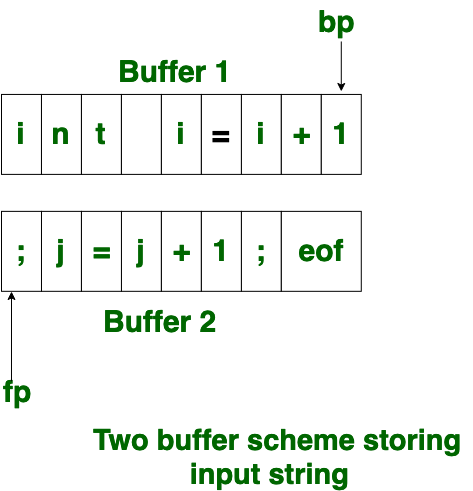
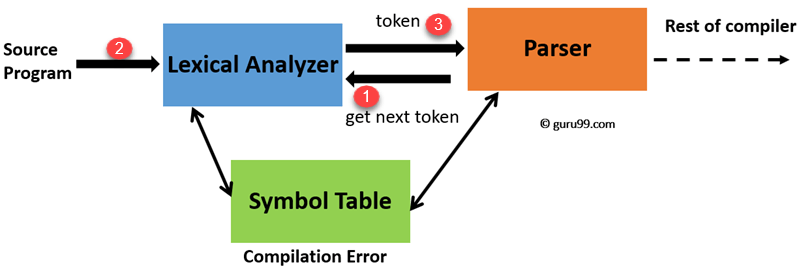
The input character is thus read from secondary storage, but reading in this way from secondary storage is costly. hence buffering technique is used.A block of data is first read into a buffer, and then second by lexical analyzer. there are two methods used in this context: One Buffer Scheme, and Two Buffer Scheme. These are explained as following below.
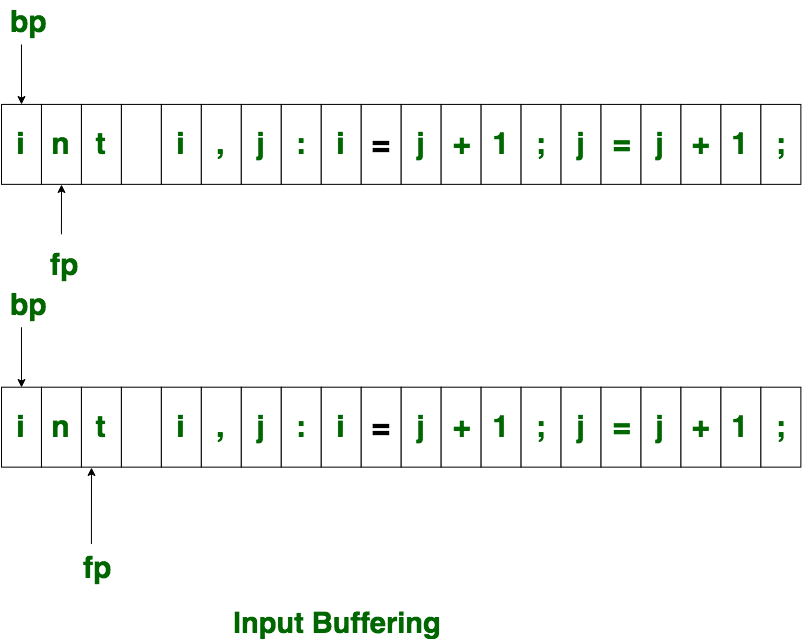
  • One Buffer Scheme: In this scheme, only one buffer is used to store the input string but the problem with this scheme is that if lexeme is very long then it crosses the buffer boundary, to scan rest of the lexeme the buffer has to be refilled, that makes overwriting the first of lexeme.
  • Two Buffer Scheme: To overcome the problem of one buffer scheme, in this method two buffers are used to store the input string. the first buffer and second buffer are scanned alternately. when end of current buffer is reached the other buffer is filled. the only problem with this method is that if length of the lexeme is longer than length of the buffer then scanning input cannot be scanned completely. Initially both the bp and fp are pointing to the first character of first buffer. Then the fp moves towards right in search of end of lexeme. as soon as blank character is recognized, the string between bp and fp is identified as corresponding token. to identify, the boundary of first buffer end of buffer character should be placed at the end first buffer. Similarly end of second buffer is also recognized by the end of buffer mark present at the end of second buffer. when fp encounters first eof, then one can recognize end of first buffer and hence filling up second buffer is started. in the same way when second eof is obtained then it indicates of second buffer. alternatively both the buffers can be filled up until end of the input program and stream of tokens is identified. This eof character introduced at the end is calling Sentinel which is used to identify the end of buffer.

Write note on MASM assembler

➜ It supports a wide variety of macro facilities and structured programming idioms, including high-level constructions for looping, procedure calls and alternation (therefore, MASM is an example of a high-level assembler). ➜ MASM is one of the few Microsoft development tools for which there was no separate 16-bit and 32-bit version. ➜ Assembler affords the programmer looking for additional performance a three pronged approach to performance based solutions. ➜ MASM can build very small high performance executable files that are well suited where size and speed matter. ➜ When additional performance is required for other languages, MASM can enhance the performance of these languages with small fast and powerful dynamic link libraries. ➜ For programmers who work in Microsoft Visual C/C++, MASM builds modules and libraries that are in the same format so the C/C++ programmer can build modules or libraries in MASM and directly link them into their own C/C++ programs. This allows the C/C++ programmer to target critical areas of their code in a very efficient and convenient manner, graphics manipulation, games, very high speed data manipulation and processing, parsing at speeds that most programmers have never seen, encryption, compression and any other form of information processing that is processor intensive. ➜ MASM32 has been designed to be familiar to programmers who have already written API based code in Windows. The invoke syntax of MASM allows functions to be called in much the same way as they are called in a high level compiler.

advantages and disadvantages of IAAS

IaaS advantages Organizations choose IaaS because it is often easier, faster and more cost-efficient to operate a workload without having to buy, manage and support the underlying infrastructure. With IaaS, a business can simply rent or lease that infrastructure from another business. IaaS is an effective cloud service model for workloads that are temporary, experimental or that change unexpectedly. For example, if a business is developing a new software product, it might be more cost-effective to host and test the application using an IaaS provider. Once the new software is tested and refined, the business can remove it from the IaaS environment for a more traditional, in-house deployment. Conversely, the business could commit that piece of software to a long-term IaaS deployment if the costs of a long-term commitment are less. In general, IaaS customers pay on a per-user basis, typically by the hour, week or month. Some IaaS providers also charge customers based on the amount of virtual machine space they use. This pay-as-you-go model eliminates the capital expense of deploying in-house hardware and software. When a business cannot use third-party providers, a private cloud built on premises can still offer the control and scalability of IaaS -- though the cost benefits no longer apply.
IaaS disadvantages Despite its flexible, pay-as-you-go model, IaaS billing can be a problem for some businesses. Cloud billing is extremely granular, and it is broken out to reflect the precise usage of services. It is common for users to experience sticker shock -- or finding costs to be higher than expected -- when reviewing the bills for every resource and service involved in application deployment. Users should monitor their IaaS environments and bills closely to understand how IaaS is being used and to avoid being charged for unauthorized services. Insight is another common problem for IaaS users. Because IaaS providers own the infrastructure, the details of their infrastructure configuration and performance are rarely transparent to IaaS users. This lack of transparency can make systems management and monitoring more difficult for users. IaaS users are also concerned about service resilience. The workload's availability and performance are highly dependent on the provider. If an IaaS provider experiences network bottlenecks or any form of internal or external downtime, the users' workloads will be affected. In addition, because IaaS is a multi-tenant architecture, the noisy neighbor issue can negatively impact users' workloads.

How do you implement IaaS?

When looking to implement an IaaS product, there are important considerations to make. The IaaS use cases and infrastructure needs should be strictly defined before different technical requirements and providers should be considered. Technical and storage needs to consider for implementing IaaS include:
  • Networking. When focusing on cloud deployments, organizations need to ask certain questions to make sure that the provisioned infrastructure in the cloud can be accessed in an efficient manner.
  • Storage. Organizations should consider requirements for storage types, required storage performance levels, possible space needed, provisioning and potential options such as object storage.
  • Compute. Organizations should consider the implications of different server, VM, CPU and memory options that cloud providers can offer.
  • Security. Data security should be of paramount importance when evaluating cloud services and providers. Questions about data encryption, certifications, compliance and regulation, and secure workloads should be pursued in detail.
  • Disaster recovery. Disaster recovery features and options are another key value area for organizations in the event of failover on VM, server or site levels.
  • Server Size. Options for server and VM sizes, how many CPUs can be placed onto servers, and other CPU and memory details.
  • Throughput of the network. Speed between VMs, data centers, storage, and internet.
  • General manageability. How many features of the IaaS can the user control, which parts do you need to control and how easy are they to control and manage?
During the implementation process, organizations should closely consider how the technical and service offerings of different providers fulfill business-side needs, as well as the business's own specific usage requirements. The market for IaaS vendors should be carefully evaluated; with considerable variance of capabilities within products, some may better align with business needs than others. Once a vendor and product are decided, it is important to negotiate all service-level agreements. Thorough negotiation with the vendor will make it less likely for your organization to be negatively affected by fine-print details that were previously unknown. Furthermore, an organization should thoroughly assess the capabilities of its IT department to determine how well equipped it is to deal with the ongoing demands of IaaS implementation. In the IaaS model, in-house developers are responsible for the infrastructure's technical maintenance -- including software patches, upgrades and troubleshooting. This personnel assessment is needed to ensure that the organization is equipped to maximize value on all fronts from an IaaS implementation.

Discuss <table> element along row spanning and column

HTML table tag is used to display data in tabular form (row * column). There can be many columns in a row.

We can create a table to display data in tabular form, using <table> element, with the help of <tr> , <td>, and <th> elements.

In Each table, table row is defined by <tr> tag, table header is defined by <th>, and table data is defined by <td> tags.

HTML tables are used to manage the layout of the page e.g. header section, navigation bar, body content, footer section etc. But it is recommended to use div tag over table to manage the layout of the page .

Tag Description
<table> It defines a table.
<tr> It defines a row in a table.
<th> It defines a header cell in a table.
<td> It defines a cell in a table.
<caption> It defines the table caption.
<colgroup> It specifies a group of one or more columns in a table for formatting.
<col> It is used with <colgroup> element to specify column properties for each column.
<tbody> It is used to group the body content in a table.
<thead> It is used to group the header content in a table.
<tfooter> It is used to group the footer content in a table.


The rowspan and colspan are <td> tag attributes. These are used to specify the number of rows or columns a cell should span. The rowspan attribute is for rows as well as the colspan attribute is for columns.

  • Row Span This attribute specifies the no. of rows a cell should span.

 Syntax:-  <td rowspan="number">

where 'number' specifies the no. of rows a cell should span.

  •  Col Span :- This attribute defines the no. of Columns a cell should span.

 Syntax:-  <td colspan="number">

where 'number' specifies the no. of column a cell should span.

What is Responsive Design? Explain the components that make responsive web design. Why its important ? explain in detail.

Responsive web design (RWD) is an approach to web design that makes web pages render well on a variety of devices and window or screen sizes from minimum to maximum display size.

Components of Responsive Web Design (RWD):-

  • Setting The Viewport

    To create a responsive website, add the following <meta> tag to all your web pages:

<meta name="viewport" content="width=device-width, initial-scale=1.0">

          This will set the viewport of your page, which will give the browser instruction on how to control the page's dimensions and scaling.

  • Responsive Images

    Responsive images are images that scale nicely to fit any browser size.

     To make an image responsive, you need to give a new value to its width property. Then the height of the image will adjust itself automatically. The important thing to know is that you should always use relative units for the width property like percentage, rather than absolute ones like pixels.
  • Media Queries

    In addition to resize text and images, it is also common to use media queries in responsive web pages.

    With media queries you can define completely different styles for different browser sizes.

  • Responsive Text Size

    The text size can be set with a "vw" unit, which means the "viewport width".

Explain the basic table Structure . Create an HTML Document for the following figure.
OneTwo
ThreeFour

Basic Table Structure

At their most basic, tables are made up cells, arranged into rows. You can control display characteristics for the whole table, for individual rows, and for individual cells.

<table border="1px" style="width:300px">
  <thead>
    <tr>
      <th>First Name</th>
      <th>Last Name</th>
      <th>Age</th>
    </tr>
  </thead>
  <tbody>
    <tr>
      <td>Jill</td>
      <td>Smith</td>       
      <td>50</td>
    </tr>
    <tr>
      <td>Eve</td>
      <td>Jackson</td>     
      <td>94</td>
    </tr>
    <tr>
      <td>John</td>
      <td>Doe</td>     
      <td>80</td>
    </tr>
  </tbody>
</table>


(1) Kinds of cell in HTML

A table cell in HTML is a non-empty element and should always be closed. There are two different kinds of table cell in HTML: normal table cell and header cell. <td> denotes a table cell, the name implying 'data', while <th> denotes a table 'header'. The two can be used interchangeably, but it is recommended that header cell be only used for the top and side headers of a table.

Syntax:-

A table cell also must be nested within a <table> tag and a <tr> (table row) tag. If there are more table cell tags in any given row than in any other, the particular <tr> must be given a colspan attribute declaring how many columns of cells wide it should be.

Example:-

An example of an HTML table containing 4 cells:

Cell 1 Cell 2
Cell 3 Cell 4


(2) Data Type

A data type must be specified for each column & for each attributes compromising on abstract data type. They are classifieed broadly as pre-defined data type.

<!DOCTYPE html>
<html>
<body>
<table border="1" cellspacing="0">
<tr>
<th rowspan="2"> One</th>
<th colspan="2">Two</th>
</tr>
<tr>
<td>Three</td>
<td>Four</td>
</tr>
</table>
</body>
</html>

 output:-


One Two
Three Four

Explain Positioning elements in CSS

The position property specifies the type of positioning method used for an element.

There are five different position values:

  1. Fixed
  2. Static
  3. Relative
  4. Absolute
  5. Sticky
  • Static :- 

    HTML elements are positioned static by default.

    Static positioned elements are not affected by the top, bottom, left, and right properties.

    An element with position: static; is not positioned in any special way; it is always positioned according to the normal flow of the page:

    This <div> element has position: static;

    Here is the CSS that is used:

    div.static {
      position: static;
      border: 3px solid #73AD21;
    }
  • position: relative;

    An element with position: relative; is positioned relative to its normal position.

    Setting the top, right, bottom, and left properties of a relatively-positioned element will cause it to be adjusted away from its normal position.

  • position: fixed;

    It is positioned relative to the viewport, which means it always stays in the same place even if the page is scrolled. The top, right, bottom, and left properties are used to position the element.

  • position: absolute;

    position: absolute; is positioned relative to the nearest positioned ancestor. However; if an absolute positioned element has no positioned ancestors, it uses the document body, and moves along with page scrolling.

  • position: sticky;

    position: sticky;  it's positioned based on the user's scroll position.

    A sticky element toggles between relative and fixed, depending on the scroll position. It is positioned relative until a given offset position is met in the viewport - then it "sticks" in place

Compare/Difference between radio button and checkbox controls of HTML 5 with Examples.

Radio button: It is generally used in HTML forms. HTML forms are required when you need to collect some data from the site visitors. A radio button is used when you want to select only one option out of several available options.

Example:

<html>


<head>

    <title>

        Radio Button

    <title>

</head>


<body>

    <form>

        Do you agree this statement?

        <br>

        <input type="radio"

               name="agree" 

               value="yes">Yes

        <br>

        <input type="radio"

               name="agree" 

               value="no">No

        <br>

        <input type="Submit">

    </form>

</body>


</html>


Checkbox: Checkboxes are also mostly used in HTML forms. A checkbox allows you to choose one or many options to be selected from a list of options.

Example:

 <form>

        Choose languages you know:

        <br>

        <input type="checkbox" 

               name="C" 

               value="yes">C

        <br>

        <input type="checkbox" 

               name="C++" 

               value="yes">C++

        <br>

        <input type="checkbox" 

               name="Java" 

               value="yes">Java

        <br>

        <input type="checkbox" 

               name="Python" 

               value="yes">Python

        <br>

        <input type="Submit">

    </form>


Difference between radio button and checkbox

Radio button Checkbox
It is used when only one option to be selected out of several available options. Checkbox allows one or many options to be selected.
It is created by using HTML <input> tag but type attribute is set to radio. It is also created using HTML <input> tag but type attribute is set to checkbox.
It is a single control unit. It is a multiple control unit.
Radio button is presented as a small circle on the screen. Checkbox is presented as a small square box on the screen.
Radio button have only 2 states namely- True & False. Checkbox have 3 states namely- Checked, unchecked & indeterminate.
It is used when you want to limit the users choice to just one option from the range provided. It is used when you want to allow user to select multiple choices.


Explain different forms of text input controls with example.

In HTML <input type=" "> is an important element of HTML form. The "type" attribute of input element can be various types, which defines information field. Such as <input type="text" name="name"> gives a text box.

1. <input type="text">:

<input> element of type "text" are used to define a single-line input text field.

example:-

<form> 

    <label>first name</label><br>  

    <input type="text" name="firstname"><br>  

</form>

2. <input type="password">:

The <input> element of type "password" allow a user to enter the password securely in a webpage. The entered text in password filed converted into "*" or ".", so that it cannot be read by another user.

 Example:-
<form>
    <label>Enter Password</label><br>  
    <input type="Password" name="password">
</form>

3. <input type="submit">:

The <input> element of type "submit" defines a submit button to submit the form to the server when the "click" event occurs.

Example

<form action="">  

    <label>User name</label><br>  

    <input type="text" name="firstname"><br>  

    <label>Enter Password</label><br>  

    <input type="Password" name="password"><br>  

    <br><input type="submit" value="submit">  

</form>  


4. <input type="radio">:

The <input> type "radio" defines the radio buttons, which allow choosing an option between a set of related options. At a time only one radio button option can be selected at a time.

Example:-
<form>  

  <p>Kindly Select your favorite color</p>  

  <input type="radio" name="color" value="red"> Red <br>  

  <input type="radio" name="color" value="blue"> blue <br>  

  <input type="radio" name="color" value="green">green <br>  

  <input type="radio" name="color" value="pink">pink <br>  

  <input type="submit" value="submit">  

</form>  

5. <input type="checkbox">:

The <input> type "checkbox" are displayed as square boxes which can be checked or unchecked to select the choices from the given options.

Examples:-

<form>   

      <label>Enter your Name:</label>  

      <input type="text" name="name">  

      <p>Kindly Select your favourite sports</p>  

      <input type="checkbox" name="sport1" value="cricket">Cricket<br>  

      <input type="checkbox" name="sport2" value="tennis">Tennis<br>  

      <input type="checkbox" name="sport3" value="football">Football<br>  

      <input type="checkbox" name="sport4" value="baseball">Baseball<br>  

      <input type="checkbox" name="sport5" value="badminton">Badminton<br><br>  

      <input type="submit" value="submit">  

  </form>  

6. <input type="button">:

The <input> type "button" defines a simple push button, which can be programmed to control a functionally on any event such as, click event.

Examples :- 
  1. <form>  
  2.      <input type="button" value="Clcik me " onclick="alert('you are learning HTML')">  
  3. </form>  


7. <input type="email">:

The <input> type "email" creates an input filed which allow a user to enter the e-mail address with pattern validation. The multiple attributes allow a user to enter more than one email address.

Example :-
<form>  
         <label>Enter your Email address</label>  
        <input type="email" name="email" required>  
        <input type="submit">
</form>     

Explain the role of display and visibility properties in CSS with examples.

The Display and visibility property specifies whether or not an element is visible.

The visibility property

The initial value of the visibility property is visible, simply meaning that the element is visible unless you change it . 

example:

<style type="text/css">
.box {
width: 100px;
height: 100px;
background-color: CornflowerBlue;
}
</style>
<div class="box">Box 1</div>
<div class="box" style="visibility: hidden;">Box 2</div>
<div class="box">Box 3</div>

→ Three boxes but the middle one has been made invisible by setting the visibility property to hidden. If you try the example, you will notice one very important thing: While the second box is not there, it does leave a pretty big hole in the page. Or in other words: The element can't be seen, but the browser still reserves the space for it! 


The display property

If you try the examples, you'll immediately notice the difference: The second box has vanished without a trace, when we used the none value for the display property.

Example:-

<style type="text/css">
.box { width: 100px; height: 100px; background-color: CornflowerBlue; }
</style>
<div class="box">Box 1</div>
<div class="box" style="display: none;">Box 2</div>
<div class="box">Box 3</div>

 The property for doing so is in fact the display property, and while it is used a lot for hiding elements, it is also used for a range of other things - for instance to shift an element between the inline and block type.

In fact, if you have hidden an element by setting display to none, the way to get it back will often be to set display to either inline or block.

Explain Basic 2D (2 Dimensional) Translation in OPENGL with example and output in OPENGL.

Translation

  • A translation moves all points in an object along the same straight -line path to new positions .

  • The path is represented by a vector, called the translation or shift vector.

  • We can write the components:
    p'x = px + tx
    p'y = py + ty

  • or in matrix form:
    P' = P + T     


Example:-

A(2,2), F(10,2), C(5,5), Translate the triangle with dx=5 , dy=6

⇒ P1=P+T


Code For OPENGL :- 

/* c program for 2d translation */

#include<stdio.h>

#include<graphics.h>

#include<conio.h>

int gd=DETECT,gm;

int n,xs[100],ys[100],i,ty,tx;

void draw();

void translate();

void main()

{

   printf("Enter number of sides of polygon: ");

   scanf("%d",&n);

   printf("Enter co-rdinates: x,y for each vertex );

   for(i=0;i<n;i++)

        scanf("%d%d",&xs[i],&ys[i]);

   printf ("Enter distances for translation (in x and y directions): ");

   scanf("%d%d",&tx,&ty);

   initgraph(&gd, &gm, "C:\\TURBOC3\\BGI\\");
      cleardevice();
      //drawing original polygon in RED color
       setcolor (RED);
      draw();
      //Doing translation
      translate();
      //drawing translated polygon in YELLOW color
      setcolor(YELLOW);
      draw();
      getch();
}
void draw()
{
    for(i=0;i<n;i++)
       line(xs[i],ys[i],xs[(i+1)%n],ys[(i+1)%n]);
}
void translate()
{
     for(i=0; i<n; i++)

   {

         xs[i]+=tx;

         ys[i]+=ty;

   }

}

Output :


Explain machine dependent features of loader

Machine-Dependent Loader Features

Absolute loader is simple and efficient, but the scheme has potential disadvantages One of the most disadvantage is the programmer has to specify the actual starting address, from where the program to be loaded. This does not create difficulty, if one program to run, but not for several programs. Further it is difficult to use subroutine libraries efficiently.

This needs the design and implementation of a more complex loader. The loader must provide program relocation and linking, as well as simple loading functions.


Relocation

The concept of program relocation is, the execution of the object program using any part of the available and sufficient memory. The object program is loaded into memory wherever there is room for it. The actual starting address of the object program is not known until load time. Relocation provides the efficient sharing of the machine with larger memory and when several independent programs are to be run together. It also supports the use of subroutine libraries efficiently. Loaders that allow for program relocation are called relocating loaders or relative loaders.

Methods for specifying relocation

Use of modification record and, use of relocation bit, are the methods available for specifying relocation. In the case of modification record, a modification record M is used in the object program to specify any relocation. In the case of use of relocation bit, each instruction is associated with one relocation bit and, these relocation bits in a Text record is gathered into bit masks.

Modification records are used in complex machines and is also called Relocation and Linkage Directory (RLD) specification. The format of the modification record (M) is as follows. The object program with relocation by Modification records is also shown here.

Modification record

col 1: M
col 2-7: relocation address
col 8-9: length (halfbyte)
col 10: flag (+/-)
col 11-17: segment name


HΛCOPY Λ000000 001077

TΛ000000 Λ1DΛ17202DΛ69202DΛ48101036ΛΛ4B105DΛ3F2FECΛ032010

TΛ00001DΛ13Λ0F2016Λ010003Λ0F200DΛ4B10105DΛ3E2003Λ454F46

TΛ001035 Λ1DΛB410ΛB400ΛB440Λ75101000ΛΛ332008Λ57C003ΛB850

TΛ001053Λ1DΛ3B2FEAΛ134000Λ4F0000ΛF1Λ..Λ53C003ΛDF2008ΛB850

TΛ00070Λ07Λ3B2FEFΛ4F0000Λ05

MΛ000007Λ05+COPY

MΛ000014Λ05+COPY

MΛ000027Λ05+COPY

EΛ000000

The relocation bit method is used for simple machines. Relocation bit is 0: no modification is necessary, and is 1: modification is needed. This is specified in the columns 10-12 of text record (T), the format of text record, along with relocation bits is as follows.

Text record

col 1: T

col 2-7: starting address

col 8-9: length (byte)

col 10-12: relocation bits

col 13-72: object code

Twelve-bit mask is used in each Text record (col:10-12 – relocation bits), since each text record contains less than 12 words, unused words are set to 0, and, any value that is to be

modified during relocation must coincide with one of these 3-byte segments. For absolute loader, there are no relocation bits column 10-69 contains object code. The object program with relocation by bit mask is as shown below. Observe FFC - means all ten words are to be modified and, E00 - means first three records are to be modified.

HΛCOPY Λ000000 00107A

TΛ000000Λ1EΛFFCΛ140033Λ481039Λ000036Λ280030Λ300015ΛΛ3C0003 Λ

TΛ00001EΛ15ΛE00Λ0C0036Λ481061Λ080033Λ4C0000ΛΛ000003Λ000000

TΛ001039Λ1EΛFFCΛ040030Λ000030ΛΛ30103FΛD8105DΛ280030Λ...

TΛ001057Λ0AΛ800Λ100036Λ4C0000ΛF1Λ001000

TΛ001061Λ19ΛFE0Λ040030ΛE01079ΛΛ508039ΛDC1079Λ2C0036Λ...

EΛ000000

 Program Linking

The Goal of program linking is to resolve the problems with external references (EXTREF) and external definitions (EXTDEF) from different control sections.

EXTDEF (external definition) - The EXTDEF statement in a control section names symbols, called external symbols, that are defined in this (present) control section and may be used by other sections.

ex: EXTDEF BUFFER, BUFFEND, LENGTH

EXTDEF LISTA, ENDA

EXTREF (external reference) - The EXTREF statement names symbols used in this (present) control section and are defined elsewhere.

ex: EXTREF RDREC, WRREC EXTREF LISTB, ENDB, LISTC, ENDC


Explain the various phases of the compiler with a simple example

The compilation process is a sequence of various phases. Each phase takes input from the previous, and passes the output on to the next phase.

LEXICAL ANALYSIS

The first phase of compiler works as a text scanner. The lexical analyzer scans the source code as a stream of characters and converts it into meaningful lexemes of the form .

SYNTAX ANALYSIS

It takes the token produced by lexical analysis as input and generates a parse tree (or syntax tree). Token arrangements are checked against the source code grammar.

SEMANTIC ANALYSIS

Checks whether the parse tree constructed follows the rules of language. E.g. assignment of values is between compatible data types, and adding string to an integer. It keeps track of identifiers, their types and expressions. It produces an annotated syntax tree as an output.

INTERMEDIATE CODE GENERATION

After semantic analysis the compiler generates an intermediate code of the source code for the target machine. It represents a program for some abstract machine. It is generated in such a way that it makes it easier to be translated into the target machine code.

CODE OPTIMIZATION

Optimization can be assumed as something that removes unnecessary code lines, and arranges the sequence of statements in order to speed up the program execution without wasting resources. CODE GENERATION This phase takes the optimized representation of the intermediate code and maps it to the target machine language (sequence of re-locatable machine code).


Explain Input Buffering. What is the drawback of using one buffer scheme and explain how it is overcome?

We often have to look one or more characters beyond the next lexeme, before we can be sure that we have the right lexeme.

For example, the symbols '<' or '=' could be the beginning of '<<', '<=', ==', etc.

Hence we need two buffer schemes to handle the large lookahead safely. The buffer pairs consist of a lexeme begin pointer (lbp) and a forward pointer (fp).

The lexeme begin pointer marks the beginning of the current lexeme, and the forward pointer scans ahead until a pattern match is found.

This concept is called Input Buffering.

When using a single buffer scheme, if the end of the current file/block is reached before the expression ends, the lexical analyzer might return an unexpected token.

For example, for input string E = M * C ** 2

... ... E = M * C * EOF ... ...
              lbp   ↑ fp  ↑    


When EOF is reached in the middle of the expression, the lexical analyzer emits '*' as a token; reloads the input buffer, emits the next '*' as another token.

Two '*'s are returned instead of '**', hence invalidating the expression.

This drawback is overcome by using two buffer schemes.

... E = M * C * EOF ...
            lbp ↑     
 
... * 2 EOF ...
    fp  ↑    

When we use two buffers, when the input ends prematurely, the other buffer is loaded with the next file’s contents. Hence, the forward pointer moves to the next file to process the continuing input. The lexical analyzer hence emits '**' as the token.

Explain with example any two algorithms used to identify the interior area of polygon.

Two commonly used algorithm :-

1> Odd - Even rule

2>The non - zero winding - number rule.

1. Odd - Even rule :-

→Also called as odd parity rule or the even-odd rule.
→Draw a line from any position P to a distant point outside the coordinator extents of the closed polyline.
→Then we count the number of line- segments crossing along this line
→If the number of segments crossed by this line is odd, then P is considered to be an interior point, otherwise P is an exterior point.
→We can use this procedure , for example , to fill the interior region between 2 concentric circles or two concentric polygons with a specified colour.

►2. Non Zero Winding - Number rule :-

→This counts the number of times that boundary of an object "winds" around a particular point in the counter clockwise direction termed as winding number.

→Initialize the winding number to 0 and again imagining a line draw from any position P to a distant point beyond the co-ordinate  extent of objects.

→The line we choose must not pass through any end point coordinates.

→As we Move along the line from positions P to the distant point, we count the number of object line segments that cross the reference line in each direction.

→We add 1 to the winding number Every time we interact a segment that crosses the line in the direction from right to left and we subtract 1 very time we interact segment that crosses from left to right.

→If the winding number is non - zero. P is considered to be an interior point, otherwise P is an exterior point.

OpenGL Fill-Pattern Function

► We generate displays of filled convex polygons in four steps:

1. Define a fill pattern.
2. Invoke the polygon-fill routine.
3. Activate the polygon-fill feature of OpenGL.
4. Describe the polygons to be filled.

► A polygon fill pattern is displayed up to and including the polygon edges. Thus, there are no boundary lines around the fill region unless we specifically add them to the display.

OpenGL Fill-Pattern Function


➢ To fill the polygon with a pattern in OpenGL, we use a 32 × 32 bit mask.
➢ A value of 1 in the mask indicates that the corresponding pixel is to be set to the current color, and a 0 leaves the value of that frame-buffer position unchanged.
➢ The fill pattern is specified in unsigned bytes using the OpenGL data type Glubyte
                → GLubyte fillPattern [ ] = { 0xff, 0x00, 0xff, 0x00, ... };
➢ The bits must be specified starting with the bottom row of the pattern, and continuing up to the topmost row (32) of the pattern.
➢ This pattern is replicated across the entire area of the display window, starting at the lower-left window corner, and specified polygons are filled where the pattern overlaps those polygons
➢ Once we have set a mask, we can establish it as the current fill pattern with the function
glPolygonStipple (fillPattern);
➢ We need to enable the fill routines before we specify the vertices for the polygons that are to be filled with the current pattern
glEnable (GL_POLYGON_STIPPLE);
➢ Similarly, we turn off pattern filling with
glDisable (GL_POLYGON_STIPPLE);


Briefly explain scope of different fields in civil engineering

1. SURVEYING:

It is the art of determining the relative position of points on the earth’s surface by measuring

the horizontal between them. Levelling is the process of determining the position of points in

a vertical plane

Surveying are of two types

1) Geodetic survey: the survey in which the shape of the earth is taken in to account is called

geodetic surveying

2) Plane survey: the survey in which the shape (or) curvature of earth is not taken in to account

is called plane surveying

The scope of surveying and levelling are:

a) To prepare plan and map which help in project implementation (setting out the alignment

for a road or railway track or canal, deciding the location for a dam or airport or harbour)

b) To determine the dimensions and contours of any part of the earth surface

c) To establish boundaries of land

d) To measure the areas and volume of land

e) To select suitable site for an engineering project

f) To conduct engineering survey, topographical survey, military survey, mine survey,

geological survey, archaeological survey, hydro graphic survey, environmental survey etc..

The Knowledge of surveying is essential in many phases for every engineering project such as

buildings, roadways, railways, dams, bridges, tunnels, harbours, mines, water supply and

sanitation, pipe line laying, airports etc..

2. BUILDING MATERIALS:

Any engineering structure requires a wide range of materials known as building materials. The

building materials chosen should have such properties that are safe, economical, eco-friendly

and serviceable for the purpose for which they are used

The building materials can be broadly divided into following categories

a. Traditional materials: stones, timber, bricks, lime, cement, tar, bitumen, mortar, ferrous

and non-ferrous metals etc

b. Alternative building materials: mud blocks, concrete blocks, glass, aluminium, paint,

flyash etc.

c. Composite materials: RCC, fibre reinforced concrete, ferro-cement, composite laminated

doors, asbestos sheets, fibre reinforced glass etc.


3. CONSTRUCTION TECHNOLOGY:

As land cost is going up there is a demand for tall structures in urban areas, while in rural areas

need for low cost construction, one has to develop technology using locally available materials

Construction technology comprises of different techniques of construction for different

materials under site different condition. The study of construction machinery comes under its

purview. The management or organization of men (labour), material, method in relation to site,

money and time is the backbone of construction management. It involves almost every branch

of engineering, commerce and economics, for; its ultimate aim is to ‘achieve the desired

construction in the most economical way. A clear knowledge of following points is necessary

for reliable construction and its management.

a) Money, Materials, Machines, Manpower, Methodologies,

b) Maintenance, Modernization, Monitoring, Motivations,

c) Managements of all types.

4. GEO-TECHNICALENGINEERING (Soil Mechanics):

The load from the structure is to be safely transferred to soil, for this safe bearing capacity of

soil is to be properly assessed. This branch of study in civil engineering is called geotechnical

engineering, which deals with the study of the properties , behaviour and use of earth materials

(soil and rocks) in engineering works

Geotechnical engineering has much wider scope that:

a) It is concerned with the properties of earth materials

b) To investigate the soil and bed rocks below the structure and study the soil structure

interaction

c) To select the type of foundation earth works for particular structure

d) To design foundation of building, dams, retaining walls, bridges, road pavement, railway

lines etc.

e) To design foundation for underground structure like tunnels, power houses etc.

f) To design foundation for machines such as turbines, compressors etc. to transmit vibrations

to foundation soil

g) To study the effect of soil as a medium for blasts during mining, earthquake, landslides and

nuclear explosionsh) They include various types of foundations like shallow foundation, deep foundations. Pile


foundation, well foundation etc.

5. STRUCTURAL ENGINEERING :


A building or a bridge or a dam consists of various elements like foundations, columns, beams,

slabs etc. These components are always subjected to forces. Depending upon the materials

available the components of the building should be safely and economically designed. A

structural engineer is involved in such a designing activity

Scope of structural engineering:

a) The structural engineering plays a vital role in planning, designing and building the structure

b) The structural analysis and structural design are the components of structural engineering

c) The structural engineering should take the responsibility about the safety and serviceability

of the structure for its life time

d) The structural engineer should be prepared for to accept the natural calamities like

earthquake, wind, landslide etc. and provide remedial measures

6. HYDRAULICS ENGINEERING :

Water is an important need for all living beings, study of mechanics of water and its flow

characteristics is another important field in civil engineering and its known as hydraulics

Hydraulics mainly deals with the practical problems of flow of water. The concept of fluid

pressure, fluid statics, and flow pattern helps in engineering to design the structures like dams,

reservoirs, bridges, culverts, sewage system etc. this concept is also used for flow through

pipes, pumps, turbines, hydraulic machines etc. Hydroelectric power generation facilities are

also included under this aspect.

7. WATER RESOURCES AND IRRIGATION ENGINEERING :

Water is to be supplied to agricultural fields and for drinking purposes, hence suitable water

resources are to be identified and water is to be stored. Identifying, planning and building water

retaining structures like tanks and dams and carrying stored water to agricultural fields through

irrigation channels is known as water resources and irrigation engineering

Scope of water resources and irrigation engineering:

a) It facilitates to control, regulate and utilize water to serve wide variety of purposes

b) It gives scope for utilization of water in beneficial purpose by providing water supply,

irrigation, hydroelectric power development and navigational improvement

c) Water quality management

d) Scope for recreational use of water resourcese) To protect fish and wild life


f) India being an agricultural country, irrigation will definitely help in the overall development

of our country, citizen and improve the civilization

8. TRANSPORTATION ENGINEERING:

Transportation means the movement of the men and goods from one point to another. It is as

old as civilization

The Transportation system includes road ways, railways, airways and water ways, design,

construction and maintenance of railway lines, signal system are part of the transportation

engineering.

Scope of water resources and transportation engineering:

a) It contributes to the economic, industrial. Social and cultural development of any country

b) To optimise the transportation cost, maintenance and administrative overheads

c) Planning the transport process with respect to survey and analysis of existing condition and

forecasting the future condition

d) It involves accident study for safe and comfort transport system

e) For traffic performance and control

9. ENVIRONMENTAL ENGINEERING :

People in every village, town & city need potable water. The water available (surface water &

ground water) may not be fit for direct consumption. In such cases, the water should be purified

and then supplied to the public. For water purification, sedimentation tanks, filter beds, etc.

should be designed. If the treatment plants are for away from the town or city, suitable pipelines

for conveying water & distributing it should also be designed.

In a town or city, a part of the water supplied returns as sewage. This sewage should be

systematically collected and then disposed into the natural environment after providing suitable

treatment. The solid waste that is generated in a town or locality should be systematically

collected and disposed of suitably. Before disposal, segregation of materials should be done so

that any material can be recycled & we can conserve our natural resources.

Scope of environmental engineering:

a) The study of importance of protection and conservation of our environment

b) The proper distribution of water supply with water treatment facility

c) Solution of problems of environment sanitation with waste water treatmentd) The proper disposal of / recycle of waste water and solid waste


e) Adequate drainage of urban, rural and recreational areas

f) Control of air pollution and provide healthy environment to public

what is user interface design ? Explain benifts of User Interface Design.

User interface design or user interface engineering is the design of user interfaces for machines and software, such as computers, home appliances, mobile devices, and other electronic devices, with the focus on maximizing usability and the user experience.

Benifits of User Interface Design :-


1. Increase customer acquisition and loyalty :-

  • A strong user experience gives you a significant competitive edge in attracting and retaining customers. The more aesthetically pleasing and intuitive a solution is, the easiest you build trust with people, and thus, the higher your chances of attracting users, converting them into customers who will want to continue using it, and encourage their contacts to do the same.

2. Maximize revenue generation opportunities :-

  • Planning your users’ journey on your platform ensures you identify and optimize all potential opportunities to convert users into buyers. You can perform A/B testing to test what users respond best to and refine the experience continuously to always outperform your best results by tweaking how intuitive the experience is, better plan interactions, and improve calls to action that convert and leads to revenue growth.

3.Optimize resources, development time and costs :-

  • Integrating UI/UX design in your development process will highlight and give you the opportunity to address most of the usability issues you’d have encountered during and after the development of your solution. UI/UX designers can anticipate the users’ needs before going to production, and ultimately ensure that the design is both flexible and scalable so that they can grow with users in the future. Adopting a user focused approach with UI/UX design will save you considerable resources, time and money.

4. Get more insights from user engagement :-

  • Engagement metrics are very valuable, they give you insights on what your customers find valuable and what makes them buy. By optimizing your platform’s user experience, you set up an experimental environment for your customers to interact your solutions, based on the engagement insights you gather, you are able to accurately measure success on a new level and shape an offering that converts consistently.

5. Reduce troubleshooting and associated costs :-

  • Approximately 50% of an enterprise’s engineering budget is spent on resolving easily avoidable errors. These errors are typically incorrect assumptions regarding user behavior, convoluted navigation that results in users getting stuck or lost, and any new features that are unwanted, unnecessary or inaccessible. Ensuring that the user design of your platform is done effectively and efficiently from the beginning will help alleviate any potential headaches in the future.

How ZooKeeper in Hadoop Works?

Hadoop ZooKeeper, is a distributed application that follows a simple client-server model where clients are nodes that make use of the service, and servers are nodes that provide the service. Multiple server nodes are collectively called ZooKeeper ensemble. At any given time, one ZooKeeper client is connected to at least one ZooKeeper server. A master node is dynamically chosen in consensus within the ensemble; thus usually, an ensemble of Zookeeper is an odd number so that there is a majority of vote. If the master node fails, another master is chosen in no time and it takes over the previous master. Other than master and slaves there are also observers in Zookeeper. Observers were brought in to address the issue of scaling. With the addition of slaves the write performance is going to be affected as voting process is expensive. So observers are slaves that do not take part into voting process but have similar duties as other slaves.

Writes in Zookeeper


All the writes in Zookeeper go through the Master node, thus it is guaranteed that all writes will be sequential. On performing write operation to the Zookeeper, each server attached to that client persists the data along with master. Thus, this makes all the servers updated about the data. However this also means that concurrent writes cannot be made. Linear writes guarantee can be problematic if Zookeeper is used for write dominant workload. Zookeeper in Hadoop, is ideally used for coordinating message exchanges between clients, which involves less writes and more reads. Zookeeper is helpful till the time the data is shared but if application has concurrent data writing then Zookeeper can come in way of the application and impose strict ordering of operations.

Reads in Zookeeper

Zookeeper is best at reads as reads can be concurrent. Concurrent reads are done as each client is attached to different server and all clients can read from the servers simultaneously, although having concurrent reads leads to eventual consistency as master is not involved. There can be cases where client may have an outdated view, which gets updated with a little delay.

Applications of Apache Ambari Core

  • Ambari Server
  • Ambari Agent
  • Ambari Web UI
  • Database

1. Ambari Server

The entry point for all administrative activities on the master server is known as Ambari Server. It is a shell script. Internally, this script uses Python code, ambari-server.py, and routes all requests to it.

Ambari Server consists of several entry points that are available when passed different parameters to the Ambari Server program. They are:

  • Daemon management
  • Software upgrade
  • Software setup
  • LDAP (Lightweight Direct Access Protocol)/PAM (Pluggable Authentication Module) /Kerberos management
  • Ambari backup and restore
  • Miscellaneous options

2. Ambari Agent


Ambari Agent runs on all the nodes that you want to manage with Ambari.  This program periodically sends heartbeats to the master node. By using Ambari Agent, Ambari Server executes many tasks on the servers.

3. Ambari Web User Interface

Ambari Web UI is one of the powerful features of Apache Ambari. The web application is deployed through the server of Ambari program which is running on the master host exposed on port 8080. This application is protected by authentication. You can access and then control and view all aspects of your Hadoop cluster, once you log in to the web portal.

4. Database


Ambari supports multiple RDBMS (Relational Database Management Systems) to keep track of the state of the entire Hadoop infrastructure. You can choose the database you want to use during the setup of Ambari. Ambari supports these following databases at the time of writing:


  • PostgreSQL
  • Oracle
  • MySQL or MariaDB
  • Embedded PostgreSQL
  • Microsoft SQL Server
  • SQL Anywhere
  • Berkeley DB

This technology is preferred by the Big Data Developers as it is quite handy and comes with a step-by-step guide allowing easy installation on the Hadoop cluster. Its preconfigured key operational metrics provide a quick look into the health of the Hadoop core, i.e., HDFS and MapReduce, along with the additional components such as Hive, HBase, HCatalog, etc. Ambari sets up a centralized security system by incorporating Kerberos and Apache Ranger into the architecture. The RESTful APIs monitor the information and integrate the operational tools. Its user-friendliness and interactivity have made it enter the list of top 10 open-source technologies for the Hadoop cluster.

Benefits of Using Apache Ambari

This is given with respect to Hortonworks Data Platform (HDP). Ambari eliminates the need for the manual tasks that used to watch over Hadoop operations. It gives a simple and secure platform for provisioning, managing, and monitoring HDP deployments. Ambari is an easy to use Hadoop management UI and is solidly backed by REST APIs. The benefits of using Apache Ambari are mentioned below.

Simplified installation, configuration, and management of the Hadoop cluster: Ambari can efficiently create Hadoop clusters at scale. Its wizard-driven approach lets the configuration be automated as per the environment so that the performance is optimal. Master–slave and client components are assigned to configuring services. It is also used to install, start, and test the cluster.

Configuration blueprints give recommendations to those seeking a hands-on approach. The blueprint of an ideal cluster is stored. How it is provisioned is clearly traced. This is then used to automate the creation of successive clusters without any user interaction. Blueprints also preserve and ensure the application of best practices across different environments.

Ambari provides a rolling upgrade feature where running clusters can be updated on the go with maintenance releases and feature-bearing releases, and therefore there is no unnecessary downtime. When there are large clusters involved, rolling updates are simply not possible, in which case express updates are used. Unlike the previous case, here, there is downtime involved but is minimum as when the update is manual. Both rolling and express updates are free of manual updates.

Centralized security and application: The complexity of cluster security configuration and administration is greatly reduced by Ambari which is among the components of the Hadoop ecosystem. The tool also helps the automated setup of the advanced security constructs like Kerberos and Ranger.

Complete visibility to your cluster’s health: Through this tool, you can monitor your cluster’s health and availability. An easily customized web-based dashboard has metrics that give status information for each service in the cluster like HDFS, YARN, and HBase. The tool also helps with garnering and visualizing critical operational metrics for troubleshooting and analysis. Ambari predefines alerts that are integrated with the existing enterprise monitoring tools that monitor cluster components and hosts as per the specified check intervals. Through the browser interface, users can browse alerts for their clusters, search, and filter alerts. They can also view and modify alert properties and alert instances.

Metrics visualization and dashboarding: It provides a scalable low-latency storage system for Hadoop component metrics. Picking the metrics of Hadoop which truly matter requires considerable expertise and understanding of how the components work with each other. Grafana is a leading graph and dashboard builder that simplifies the metrics reviewing process. This is included with Ambari Metrics, along with HDP.

Extensibility and customization: Ambari lets a developer work on Hadoop gracefully in his/her enterprise setup. Ambari leverages the large innovative community which improves upon the tool and it also eliminates vendor lock-in. REST APIs along with Ambari Stacks and Views allows extensive flexibility for customization of HDP implementation.

Ambari Stacks wraps the life cycle control layer used to rationalize operations over a broad set of services. This includes a consistent approach that Ambari uses to manage different types of services like install, start, configure, status, and stop. When provisioning, cluster install experience is rationalized across a set of services by Stacks technology. A natural extension point for operators is provided by Stacks to plug in newly created services that can perform alongside Hadoop.

Third parties can plug in their views through Ambari Views. A view is an application that is deployed into an Ambari container where it offers UI capabilities to be plugged in to give out custom visualization, management, and monitoring features.

Demonstrate with suitable examples phrasing the menu.

A menu must communicate to the user information about:

  • The nature and purpose of the menu itself.
  • The nature and purpose of each presented choice.
  • How the proper choice or choices may be selected.

Menu Titles 

  • Main menu:—Create a short, simple, clear, and distinctive title, describing the purpose of the entire series of choices.
  • Submenus: — Submenu titles must be worded exactly the same as the menu choice previously selected to display them.
  • General: —
    • Locate the title at the top of the listing of choices.
    • Spell out the title fully using either an:
      • Uppercase font.
      • Mixed-case font in the headline style.
    • Superfluous titles may be omitted.

Menu Choice Descriptions 

  • Create meaningful choice descriptions that are familiar, fully spelled out, concise, and distinctive.
  • Descriptions may be single words, compound words, or multiple words or phrases.
    • Exception: Menu bar items should be a single word (if possible).
    • Place the keyword first, usually a verb.
    • Use the headline style, capitalizing the first letter of each significant word in the choice description.
    • Use task-oriented not data-oriented wording.
    • Use parallel construction.
    • A menu choice must never have the same wording as its menu title.
    • Identical choices on different menus should be worded identically.
    • Choices should not be numbered.
    • Exception: If the listing is numeric in nature, graphic, or a list of varying items it may be numbered. 
    •  If menu options will be used in conjunction with a command language, the capitalization and syntax of the choices should be consistent with the command language.
    • Word choices as commands to the computer. 

 Menu Instructions

  • For novice or inexperienced users, provide menu completion instructions.
    • Place the instructions in a position just preceding the part, or parts, of the menu to which they apply.
      • Left-justify the instruction and indent the related menu choice descriptions a minimum of three spaces to the right.
      • Leave a space line, if possible, between the instructions and the related menu choice descriptio
    • Present instructions in a mixed-case font in sentence style.
  • For expert users, make these instructions easy to ignore by:
    • Presenting them in a consistent location.
    • Displaying them in a unique type style and/or color. 

Intent Indicators

  • Cascade indicator:
    • To indicate that selection of an item will lead to a submenu, place a triangle or right-pointing solid arrow following the choice.
    • A cascade indicator must designate every cascaded menu.
  • To a window indicator:
    • For choices that result in displaying a window to collect more information, place an ellipsis (. . .) immediately following the choice.
      • Exception do not use when an action:
        • Causes a warning window to be displayed.
        • May or may not lead to a window.
  • ​​​​​​​Direct action items: — For choices that directly perform an action, no special indicator should be placed on the menu. 

Keyboard Equivalents 

  • To facilitate keyboard selection of a menu choice, each menu item should be assigned a keyboard equivalent mnemonic.
  • The mnemonic should be the first character of the menu item’s description.
    • If duplication exists in first characters, use another character in the duplicated item’s description.
    • Preferably choose the first succeeding consonant.
  • Designate the mnemonic character by underlining it.
  • Use industry-standard keyboard access equivalents when they exist.

Keyboard Accelerators 

  • For frequently used items, provide a keyboard accelerator to facilitate keyboard selection.
  • The accelerator may be one function key or a combination of keys.
    • Function key shortcuts are easier to learn than modifier plus letter shortcuts.
  • Pressing no more than two keys simultaneously is preferred.
    • Do not exceed three simultaneous keystrokes.
  • Use a plus (+) sign to indicate that two or more keys must be pressed at the same time.
  • Accelerators should have some associative value to the item.
  • Identify the keys by their actual key top engraving.
  • If keyboard terminology differences exist, use:
    • The most common keyboard terminology.
    • Terminology contained on the newest PCs.
  • Separate the accelerator from the item description by three spaces.
  • Right-align the key descriptions.
  • Do not use accelerators for:
    • Menu items that have cascaded menus.
    • Pop-up menus. Use industry-standard keyboard accelerators 

Discuss The Common Usability Problems In Graphical System

Common Usability Problems:

Mandel (1994) lists the 10 most common usability problems in graphical systems as reported by IBM usability specialists. They are:

  • Ambiguous menus and icons.
  • Languages that permit only single-direction movement through a system.
  • Input and direct manipulation limits.
  • Highlighting and selection limitations.
  • Unclear step sequences.
  • More steps to manage the interface than to perform tasks.
  • Complex linkage between and within applications.
  • Inadequate feedback and confirmation.
  • Lack of system anticipation and intelligence.
  • Inadequate error messages, help, tutorials, and documentation.

The Web, with its dynamic capabilities and explosive entrance into our lives, has unleashed what seems like more than its own share of usability problems. Many are similar to those outlined above. Web usability characteristics particularly wasteful of people’s time, and often quite irritating, are:

Visual clutter. A lack of “white space,” meaningless graphics, and unnecessary and wasteful decoration often turn pages into jungles of visual noise. Meaningful content lies hidden within the unending forest of vines and trees, forcing the user to waste countless minutes searching for what is relevant. Useless displayed elements are actually a form of visual noise.

Impaired information readability. Page readability is diminished by poor developer choices in typefaces, colors, and graphics. Use of innumerable typefaces and kaleidoscopic colors wrestle meaning from the screen. A person’s attention is directed towards trying to understand why the differences exist, instead of being focused toward identifying and understanding the page’s content. Backgrounds that are brightly colored or contain pictures or patterns greatly diminish the legibility of the overwritten text.

Incomprehensible components. Some design elements give the user no clue as to their function, leaving their purpose not at all obvious. Some icons and graphics, for example, are shrouded in mystery, containing no text to explain what they do. Some buttons don’t look at all like command buttons, forcing the user to “minesweep” the screen with a mouse to locate the objects that can be used to do something. Command buttons or areas that give no visual indication that they are clickable often won’t be clicked. Language is also often confusing, with the developer’s terminology being used, not that of the user.

Annoying distractions. Elements constantly in motion, scrolling marquees or text, blinking text, or looping continually running animations compete with meaningful content for the user’s eye’s and attention—and destroy a page’s readability. Automatically presented music or other sounds interrupt one’s concentration, as do nonrequested pop-up widows, which must be removed, wasting more of the user’s time. A person’s senses are under constant attack, and the benefits afforded by one’s peripheral vision are negated.

Confusing navigation. A site’s structure often resembles a maze of twisting pages into which the user wanders and is quite soon lost. Poor, little, or no organization exists among pages. The size and depth of many Web sites can eventually lead to a “lost in space” feeling as perceived site structure evaporates as one navigates. Embarking on a side trip can lead to a radical change in context or a path with no signposts or landmarks. Navigation links lead to dead-ends from which there is no return, or boomerang you right back to the spot where you are standing without you being aware of it. Some navigation elements are invisible. (See mystery icons and minesweeping above.) Confusing navigation violates expectations and results in disturbing unexpected behavior.

Inefficient navigation. A person must transverse content-free pages to find what is meaningful. One whole screen is used to point to another. Large graphics waste screen space and add to the page count. The path through the navigation maze is often long and tedious. Reams of useless data must be sifted through before a need can be fulfilled. Massive use of short pages with little content often creates the feeling that one is “link drunk.”

Inefficient operations. Time is wasted doing many things. Page download times can be excessive. Pages that contain, for example, large graphics and maps, large chunky headings, or many colors, take longer to download than text. Excessive information fragmentation can require navigation of long chains of links to reach relevant material, also accelerating user disorientation.

Excessive or inefficient page scrolling. Long pages requiring scrolling frequently lead to the user’s losing context as related information’s spatial proximity increases and some information entirely disappears from view and, therefore, from memory. Out of sight is often out of mind. If navigation elements and important content are hidden below the page top, they may be missed entirely. To have to scroll to do something important or complete a task can be very annoying; especially if the scrolling is caused by what the user considers is an irrelevancy or noise.

Information overload. Poorly organized or large amounts of information taxes one’s memory and can be overwhelming. Heavy mental loads can result from making decisions concerning which links to follow and which to abandon, given the large number of choices available. Or from trying to determine what information is important, and what is not. Or from trying to maintain one’s place in a huge forest of information trees. One easily becomes buried in decisions and information. Requiring even minimal amounts of learning to use a Web site adds to the mental load.

Design inconsistency. Design inconsistency has not disappeared with the Web. It has been magnified. The business system user may visit a handful of systems in one day, the Web user may visit dozens, or many more. It is expected that site differences will and must exist because each Web site owner strives for its own identity. For the user’s sake, however, some consistency must exist to permit a seamless flow between sites. Consistency is needed in, for example, navigation element location on a page and the look of navigation buttons (raised). The industry is diligently working on this topic and some “common practices” are already in place. The learning principle of rote memorization, however, is still being required within many sites. For example, the industry practice of using different standard link colors for unvisited sites (blue) and visited sites (purple) is often violated. This forces users to remember different color meanings in different places, and this also causes confusion between links and underlined text. Design guidelines for graphical user interfaces have been available for many years. Too often they are ignored (or the designer is unaware of them). Examples of inappropriate uses abound in design. The use of check boxes instead of radio buttons for mutually exclusive options, for example. Or the use of drop-down list boxes instead of combination boxes when the task mostly requires keyboard form fill-in. The Web is a form of the graphical user interface, and GUI guidelines should be followed.

Outdated information. One important value of a Web site is its “currentness.” Outdated information destroys a site’s credibility in the minds of many users, and therefore its usefulness. A useless site is not very usable.

Stale design caused by emulation of printed documents and past systems. The Web is a new medium with expanded user interaction and information display possibilities. While much of what we have learned in the print world and past information systems interface design can be ported to the Web, all of what we know should not be blindly moved from one to the other. Web sites should be rethought and redesigned using the most appropriate and robust design techniques available.

Some of these usability problems are a result of the Web’s “growing pains.” For other problems developers themselves can only be blamed, for they too often have created a product to please themselves and “look cool,” not to please their users. Symptoms of this approach include overuse of bleeding edge technology, a focus on sparkle, and jumping to implement the latest Internet technique or buzzword. These problems, of course, did not start with the Web. They have existed since designers began building user interfaces.

Explain the important human characteristics in design.

Important Human Characteristics in Design  :-

Perception

  • Perception is our awareness and understanding of the elements and objects of our environment through the physical sensation of our various senses, including sight, sound, smell, and so forth. Perception is influenced, in part, by experience.
  • Other perceptual characteristics include the following: 
    • Proximity. Our eyes and mind see objects as belonging together if they are near each other in space.
    • Similarity. Our eyes and mind see objects as belonging together if they share a common visual property, such as color, size, shape, brightness, or orientation.
    • Matching patterns. We respond similarly to the same shape in different sizes. The letters of the alphabet, for example, possess the same meaning, regardless of physical size.
    • Succinctness. We see an object as having some perfect or simple shape because perfection or simplicity is easier to remember.
    • Closure. Our perception is synthetic; it establishes meaningful wholes. If something does not quite close itself, such as a circle, square, triangle, or word, we see it as closed anyway.
    • Unity. Objects that form closed shapes are perceived as a group.
    • Continuity. Shortened lines may be automatically extended.
    • Balance. We desire stabilization or equilibrium in our viewing environment. Vertical, horizontal, and right angles are the most visually satisfying and easiest to look at.
    • Expectancies. Perception is also influenced by expectancies;  sometimes we perceive not what is there but what we expect to be there. Missing a spelling mistake in proofreading something we write is often an example of a perceptual expectancy error; we see not how a word is spelled, but how we expect to see it spelled.
    • Context. Context, environment, and surroundings also influence individual perception. For example, two drawn lines of the same length may look the same length or different lengths, depending on the angle of adjacent lines or what other people have said about the size of the lines.
    • Signals versus noise. Our sensing mechanisms are bombarded by many stimuli, some of which are important and some of which are not.  Important stimuli are called signals; those that are not important or unwanted are called noise. 

Memory

  • Memory is viewed as consisting of two components, long-term and short-term (or working) memory.
  • Short-term, or working, memory receives information from either the senses or long-term memory, but usually cannot receive both at once, the senses being processed separately. Within short-term memory a limited amount of information processing takes place. Information stored within it is variously thought to last from 10 to 30 seconds, with the lower number being the most reasonable speculation. Knowledge, experience, and familiarity govern the size and complexity of the information that can be remembered.
  • Long-term memory contains the knowledge we possess. Information received in short-term memory is transferred to it and encoded within it, a process we call learning. It is a complex process requiring some effort on our part. 
  • The learning process is improved if the information being transferred from short- term memory has structure and is meaningful and familiar.
  • Learning is also improved through repetition. Unlike short-term memory, with its distinct limitations, long-term memory capacity is thought to be unlimited. An important memory consideration, with significant implications for interface design, is the difference in ability to recognize or recall words. 

Sensory Storage

  • Sensory storage is the buffer where the automatic processing of information collected from our senses takes place. It is an unconscious process, large, attentive to the environment, quick to detect changes, and constantly being replaced by newly gathered stimuli. In a sense, it acts like radar, constantly scanning the environment for things that are important to pass on to higher memory.
  • Repeated and excessive stimulation can fatigue the sensory storage mechanism, making it less attentive and unable to distinguish what is important (called habituation). Avoid unnecessarily stressing it.
  • Design the interface so that all aspects and elements serve a definite purpose. Eliminating interface noise will ensure that important things will be less likely to be missed. 

Visual Acuity

  • The capacity of the eye to resolve details is called visual acuity. It is the phenomenon that results in an object becoming more distinct as we turn our eyes toward it and rapidly losing distinctness as we turn our eyes away—that is, as the visual angle from the point of fixation increases.
  • It has been shown that relative visual acuity is approximately halved at a distance of 2.5 degrees from the point of eye fixation.
  • The eye’s sensitivity increases for those characters closest to the fixation point (the ―0‖) and decreases for those characters at the extreme edges of the circle (a 50/50 chance exists for getting these characters correctly identified). This may be presumed to be a visual ―chunk‖ of a screen.

Foveal and Peripheral Vision

  • Foveal vision is used to focus directly on something; peripheral vision senses anything in the area surrounding the location we are looking at, but what is there cannot be clearly resolved because of the limitations in visual acuity just described.
  • Foveal and peripheral vision maintain, at the same time, a cooperative and a competitive relationship. Peripheral vision can aid a visual search, but can also be distracting. 
  • In its cooperative nature, peripheral vision is thought to provide clues to where the eye should go next in the visual search of a screen.
  • In its competitive nature, peripheral vision can compete with foveal vision for attention. What is sensed in the periphery is passed on to our information- processing system along with what is actively being viewed foveally. 

Information Processing

  • The information that our senses collect that is deemed important enough to do something about then has to be processed in some meaningful way.
  • There are two levels of information processing going on within us. One level, the highest level, is identified with consciousness and working memory. It is limited, slow, and sequential, and is used for reading and understanding.
  • In addition to this higher level, there exists a lower level of information processing, and the limit of its capacity is unknown. This lower level processes familiar information rapidly, in parallel with the higher level, and without conscious effort.
  • Both levels function simultaneously, the higher level performing reasoning and problem solving, the lower level perceiving the physical form of information sensed. 

Mental Models 

  • A mental model is simply an internal representation of a person’s current understanding of something. Usually a person cannot describe this mental mode and most often is unaware it even exists.
  • Mental models are gradually developed in order to understand something, explain things, make decisions, do something, or interact with another person. Mental models also enable a person to predict the actions necessary to do things if the action has been forgotten or has not yet been encountered.
  • A person already familiar with one computer system will bring to another system a mental model containing specific visual and usage expectations. If the new system complies with already-established models, it will be much easier to learn and use.
  • The key to forming a transferable mental model of a system is design consistency and design standards. 

Movement Control

  • Particularly important in screen design is Fitts’ Law (1954). This law states that:
    • The time to acquire a target is a function of the distance to and size of the target.
    • This simply means that the bigger the target is, or the closer the target is, the faster it will be reached.
    • The implications in screen design are:
      • Provide large objects for important functions.
      • Take advantage of the ―pinning‖ actions of the sides, top, bottom, and corners of the screen. 

Learning

  • Learning, as has been said, is the process of encoding in long-term memory information.
  • A design developed to minimize human learning time can greatly accelerate human performance. People prefer to stick with what they know, and they prefer to jump in and get started that is contained in short-term memory.
  • Learning can be enhanced if it:
    • Allows skills acquired in one situation to be used in another somewhat like it. Design consistency accomplishes this.
    • Provides complete and prompt feedback.
    • Is phased, that is, it requires a person to know only the information needed at that stage of the learning process. 

Skill 

  • The goal of human performance is to perform skillfully. To do so requires linking inputs and responses into a sequence of action. The essence of skill is performance of actions or movements in the correct time sequence with adequate precision.
  • Skills are hierarchical in nature, and many basic skills may be integrated to form increasingly complex ones. Lower-order skills tend to become routine and may drop out of consciousness. 

Individual Differences 

  • In reality, there is no average user. A complicating but very advantageous human characteristic is that we all differ—in looks, feelings, motor abilities, intellectual abilities, learning abilities and speed, and so on.
  • Individual differences complicate design because the design must permit people with widely varying characteristics to satisfactorily and comfortably learn the task or job, or use the Web site.
  • Multiple versions of a system can easily be created. Design must provide for the needs of all potential users. 

Define Data structures. Classify the data structures.

Data Structure can be defined as the group of data elements which provides an efficient way of storing and organising data in the computer so that it can be used efficiently. Some examples of Data Structures are arrays, Linked List, Stack, Queue, etc. Data Structures are widely used in almost every aspect of Computer Science i.e. Operating System, Compiler Design, Artifical intelligence, Graphics and many more.


Data Structures are the main part of many computer science algorithms as they enable the programmers to handle the data in an efficient way. It plays a vital role in enhancing the performance of a software or a program as the main function of the software is to store and retrieve the user's data as fast as possible.

Data Structure Classification

  • Primitive Data Structure
  • Non Primitive Data Structure
    • Linear
      • Static
        • Array
      • Dynamic
        • Linked list
        • Stack
        • Queue
    • Non Linear
      • Tree
      • Graph


Linear Data Structures: A data structure is called linear if all of its elements are arranged in the linear order. In linear data structures, the elements are stored in non-hierarchical way where each element has the successors and predecessors except the first and last element.

  • Types of Linear Data Structures are given below:

Arrays: An array is a collection of similar type of data items and each data item is called an element of the array. The data type of the element may be any valid data type like char, int, float or double.

The elements of array share the same variable name but each one carries a different index number known as subscript. The array can be one dimensional, two dimensional or multidimensional.

The individual elements of the array age are:

age[0], age[1], age[2], age[3],......... age[98], age[99].

Linked List: Linked list is a linear data structure which is used to maintain a list in the memory. It can be seen as the collection of nodes stored at non-contiguous memory locations. Each node of the list contains a pointer to its adjacent node.

Stack: Stack is a linear list in which insertion and deletions are allowed only at one end, called top.

A stack is an abstract data type (ADT), can be implemented in most of the programming languages. It is named as stack because it behaves like a real-world stack, for example: - piles of plates or deck of cards etc.

Queue: Queue is a linear list in which elements can be inserted only at one end called rear and deleted only at the other end called front.

It is an abstract data structure, similar to stack. Queue is opened at both end therefore it follows First-In-First-Out (FIFO) methodology for storing the data items.


Non Linear Data Structures : This data structure does not form a sequence i.e. each item or element is connected with two or more other items in a non-linear arrangement. The data elements are not arranged in sequential structure.

  • Types of Non Linear Data Structures are given below:

Trees: Trees are multilevel data structures with a hierarchical relationship among its elements known as nodes. The bottommost nodes in the herierchy are called leaf node while the topmost node is called root node. Each node contains pointers to point adjacent nodes.

Tree data structure is based on the parent-child relationship among the nodes. Each node in the tree can have more than one children except the leaf nodes whereas each node can have atmost one parent except the root node. Trees can be classfied into many categories which will be discussed later in this tutorial.

Graphs: Graphs can be defined as the pictorial representation of the set of elements (represented by vertices) connected by the links known as edges. A graph is different from tree in the sense that a graph can have cycle while the tree can not have the one.

Features of Hadoop

1. Fault-efficient scalable, flexible and modular design:

  • uses simple and modular programming model.
  • The system provides servers at high scalability. The system is scalable by adding new nodes to handle larger data.
  • Hadoop proves very helpful in storing, managing, processing and analyzing Big Data.
  • Modular functions make the system flexible.
  • One can add or replace components at ease.
  • Modularity allows replacing its components for a different software tool.

2. Robust design of HDFS:

  • Execution of Big Data applications continue even when an individual server or cluster fails.
  • This is because of Hadoop provisions for backup (due to replications at least three times for each data block) and a data recovery mechanism.
  • HDFS thus has high reliability.

3. Store and process Big Data:

  • Processes Big Data of 3V characteristics.

4. Distributed clusters computing model with data locality :

  • Processes Big Data at high speed as the application tasks and sub-tasks submit to the DataNodes.
  • One can achieve more computing power by increasing the number of computing nodes.
  • The processing splits across multiple DataNodes (servers), and thus fast processing and aggregated results.

5. Hardware fault-tolerant:

  • A fault does not affect data and application processing. If a node goes down, the other nodes take care of the residue.
  • This is due to multiple copies of all data blocks which replicate automatically.
  • Default is three copies of data blocks.

6. Open-source framework:

  • Open source access and cloud services enable large data store. Hadoop uses a cluster of multiple inexpensive servers or the cloud.

7. Java and Linux based:

  • Hadoop uses Java interfaces. Hadoop base is Linux but has its own set of shell commands support.

Explain the benifits and importance of good design in UID (User Interface Design).

Importance of Good Design 

  • Inspite of today’s rich technologies and tools we are unable to provide effective and usable screen because lack of time and care.
  • A well-designed interface and screen is terribly important to our users. It is their window to view the capabilities of the system and it is also the vehicle trough which complex tasks can be performed.
  • A screen’s layout and appearance affect a person in a variety of ways. If they are confusing and inefficient, people will have greater difficulty in doing their jobs and will make more mistakes.
  • Poor design may even chase some people away from a system permanently. It can also lead to aggravation, frustration, and increased stress.

Benefits of Good Design 

  • The benefits of a well-designed screen have also been under experimental scrutiny for many years. One researcher, for example, attempted to improve screen clarity and readability by making screens less crowded. The result: screen users of the modified screens completed transactions in 25 percent less time and with 25 percent fewer errors than those who used the original screens.
  • Another researcher has reported that reformatting inquiry screens following good design principles reduced decision-making time by about 40 percent, resulting in a savings of 79 person-years in the affected system.
  • Other benefits also accrue from good design (Karat, 1997). Training costs are lowered because training time is reduced, support line costs are lowered because fewer assist calls are necessary, and employee satisfaction is increased because aggravation and frustration are reduced.
  • Another benefit is, ultimately, that an organization’s customers benefit because of the improved service they receive.
  • Identifying and resolving problems during the design and development process also has significant economic benefits.

Characteristics of the Graphical User Interface(GUI).

Sophisticated Visual Presentation

  • Visual presentation is the visual aspect of the interface. It is what people see on the screen. The sophistication of a graphical system permits displaying lines, including drawings and icons. It also permits the displaying of a variety of character fonts, including different sizes and styles.
  • The meaningful interface elements visually presented to the user in agraphical system include windows (primary, secondary, or dialog boxes), menus (menu bar, pull down, pop-up, cascading), icons to represent objects such as programs or files, assorted screen-based controls (text boxes, list boxes, combination boxes, settings, scroll bars, and buttons), and a mouse pointer and cursor. The objective is to reflect visually on the screen the real world of the user as realistically, meaningfully, simply, and clearly as possible.

Pick-and-Click Interaction

  • To identify a proposed action is commonly referred to as pick, the signal to perform an action as click.
  • The primary mechanism for performing this pick-and-click is most often the mouse and its buttons and the secondary mechanism for performing these selection actions is the keyboard.

Restricted Set of Interface Options

  • The array of alternatives available to the user is what is presented on the screen or what may be retrieved through what is presented on the screen, nothing less, and nothing more. This concept fostered the acronym WYSIWYG.

Visualization

  • Visualization is a cognitive process that allows people to understand information that is difficult to perceive, because it is either too voluminous or too abstract.
  • The goal is not necessarily to reproduce a realistic graphical image, but to produce one that conveys the most relevant information. Effective visualizations can facilitate mental insights, increase productivity, and foster faster and more accurate use of data.

Object Orientation

  • A graphical system consists of objects and actions. Objects are what people see on the screen as a single unit.
  • Objects can be composed of subobjects. For example, an object may be a document and its subobjects may be a paragraph, sentence, word, and letter.
  • Objects are divided into three meaningful classes as Data objects, which present information, container objects to hold other objects and Device objects represent physical objects in the real world.
  • Objects can exist within the context of other objects, and one object may affect the way another object appears or behaves. These relationships are called collections, constraints, composites, and containers.
  • Properties or Attributes of Objects : Properties are the unique characteristics of an object. Properties help to describe an object and can be changed by users.
  • Actions: People take actions on objects. They manipulate objects in specific ways (commands) or modify the properties of objects (property or attribute specification).
  • The following is a typical property/attribute specification sequence:
    • The user selects an object—for example, several words of text.
    • The user then selects an action to apply to that object, such as the action BOLD.
    • The selected words are made bold and will remain bold until selected and changed again.

Use of Recognition Memory 

  •  Continuous visibility of objects and actions encourages to eliminate ― out of sight, out of mind‖ problem.

Concurrent Performance of Functions 

  • Graphic systems may do two or more things at one time. Multiple programs may run simultaneously.
  • It may process background tasks (cooperative multitasking) or preemptive multitasking.
  • Data may also be transferred between programs. It may be temporarily stored on a clipboard for later transfer or be automatically swapped between programs.

Discuss the Principles of energy management.

1. Identification and tracking of Energy Pattern:-

Th​e first step of any program is identifying and tracking the energy pattern of that program. If we do not have the knowledge of when and where the energy is used, then there is no way to estimate the relative importance of any Energy Management Project.

2. Controlled energy system’s use:

To obtain more energy saving, it is not important to install more and more efficient components like electronic ballasts for T-8 lamps, etc. Instead, what is more important is that we must keep a check on the system’s use and ensure that the resources are aptly used.

3. Properly maintained and managed facilities:

A program with effectively maintained and managed facilities is the only program that offers effective Energy Management. The quantity of technological equipment has nothing to do with the success of the energy management program.

4. Good Maintenance practices:

To attain the highest rates of return on Energy Conservation, it is important to keep in mind the maintenance practices in the program. We know that Great Maintenance and Successful Energy Management go hand in hand, so simply by performing maintenance, we can achieve success in any energy management programs.

5. Preventive and Reactive Maintenance:

Despite the funding limitations, we know that waiting for any crisis to take place is a waste of time, i.e., reactive maintenance is imprudence. On the contrary, preventive maintenance is critical for the program’s success. It can be ignored when systems are new, heat exchange systems are clean, seals are tight and calibrations are precise. However, as the system ages, these items need care or preventive maintenance.

6. Distinction between Maintenance and Energy Management:

One should know the clear distinction between Maintenance and Energy Management. Cleaning and fixing of equipment for better use come under good maintenance while installation of more efficient equipment comes under good energy management. Both of these serve different purposes. It is very important to remember their differences whenever a budget is being prepared for any program.

7. Automated Energy Management Systems:

Even the most overrated technologies of automated energy management systems cannot recompense for a poor HVAC system design. No automation can bring more performance out of any system components if heating and cooling of loads is incorrectly calculated or if the set of equipment is inappropriate.

Define Energy Audit. Explain the need for Energy Audit.

Energy Audit:

Energy Audit is defined as “the verification, monitoring and analysis of use of energy including submission of technical report containing recommendations for improving energy efficiency with cost benefit analysis and an action plan to reduce energy consumption”.

Need for Energy Audit :

In any industry, the three top operating expenses are often found to be energy (both electrical and thermal), labour and materials. If one were to relate to the manageability of the cost or potential cost savings in each of the above components, energy would invariably emerge as a top ranker, and thus energy management function constitutes a strategic area for cost reduction. Energy Audit will help to understand more about the ways energy and fuel are used in any industry, and help in identifying the areas where waste can occur and where scope for improvement exists.

The Energy Audit would give a positive orientation to the energy cost reduction, preventive maintenance and quality control programmes which are vital for production and utility activities. Such an audit programme will help to keep focus on variations which occur in the energy costs, availability and reliability of supply of energy, decide on appropriate energy mix, identify energy conservation technologies, retrofit for energy conservation equipment etc.

In general, Energy Audit is the translation of conservation ideas into realities, by lending technically feasible solutions with economic and other organizational considerations within a specified time frame.

The primary objective of Energy Audit is to determine ways to reduce energy consumption per unit of product output or to lower operating costs. Energy Audit provides a “ bench-mark” (Reference point) for managing energy in the organization and also provides the basis for planning a more effective use of energy throughout the organization.

Explain the concept of Direct and In-direct manipulation?

DIRECT MANIPULATION :-

Direct manipulation (DM) is an interaction style in which users act on displayed objects of interest using physical, incremental, reversible actions whose effects are immediately visible on the screen. Direct manipulation is one of the central concepts of graphical user interfaces (GUIs) and is sometimes equated with “what you see is what you get” (WYSIWYG). These interfaces combine menu-based interaction with physical actions such as dragging and dropping in order to help the user use the interface with minimal learning.

The term direct manipulation is given by Shneiderman (1982) as they possess the following characteristics:

i. The system is portrayed as an extension of the real world.

ii. Continuous visibility of objects and actions.

iii. Actions are rapid and incremental with visible display of results.

iv. Incremental actions are easily reversible.

Example for direct manipulation:

On a mobile phone you can pinch out to zoom into an image and pinch in to zoom out. The action of using your fingertips to zoom in and out of the image is an example of a direct-manipulation interaction. Another classic example is dragging a file from a folder to another one in order to move it.

INDIRECT MANIPULATION :-

Indirect manipulation substitutes words and text, such as pull-down or pop-up menus, for symbols and substitutes typing for pointing. Most window systems are a combination of both direct manipulation and indirect manipulation.

In practice, direct manipulation of all screen objects and actions may not be feasible because of the following:

i. The operation may be difficult to conceptualize in graphical system.

ii. The graphics capability of the system may be limited.

iii. The amount of space available for placing manipulation controls in the window border may be limited.

iv. It may be difficult for people to learn and remember all the necessary operations and actions.

List and explain the characteristics of graphical user interface.

Characteristics of the Graphical User Interface

  • Sophisticated Visual Presentation.
  • Pick-and-Click Interaction.
  • Restricted Set of Interface Options.
  • Visualization.
  • Object Orientation.
  • Use of Recognition Memory.
  • Concurrent Performance of Functions.

Sophisticated Visual Presentation :- 

Visual presentation is the visual aspect of the interface. It is what people see on the screen. The sophistication of a graphical system permits displaying lines, including drawings and icons. It also permits the displaying of a variety of character fonts, including different sizes and styles.

The meaningful interface elements visually presented to the user in a graphical system include windows (primary, secondary, or dialog boxes), menus (menu bar, pulldown, pop-up, cascading), icons to represent objects such as programs or files, assorted screen-based controls (text boxes, list boxes, combination boxes, settings, scroll bars, and buttons), and a mouse pointer and cursor. The objective is to reflect visually on the screen the real world of the user as realistically, meaningfully, simply, and clearly as possible.

Pick-and-Click Interaction:-

To identify a proposed action is commonly referred to as pick, the signal to perform an action as click. The primary mechanism for performing this pick-and-click is most often the mouse and its buttons and the secondary mechanism for performing these selection actions is the keyboard.

Restricted Set of Interface Options:-

The array of alternatives available to the user is what is presented on the screen or what may be retrieved through what is presented on the screen, nothing less, and nothing more. This concept fostered the acronym WYSIWYG.

Visualization:-

Visualization is a cognitive process that allows people to understand information that is difficult to perceive, because it is either too voluminous or too abstract. The goal is not necessarily to reproduce a realistic graphical image, but to produce one that conveys the most relevant information. Effective visualizations can facilitate mental insights, increase productivity, and foster faster and more accurate use of data.

Object Orientation:-

  • A graphical system consists of objects and actions. Objects are what people see on the screen as a single unit. 
  • Objects can be composed of subobjects .For example, an object may be a document and its subbjects may be a paragraph, sentence, word, and letter.
  • Objects are divided into three meaningful classes as Data objects, which present information, container objects to hold other objects and Device objects, represent physical objects in the real world. 
  • Objects can exist within the context of other objects, and one object may affect the way another object appears or behaves. These relationships are called collections, constraints, composites, and containers.

Use of Recognition Memory:-

 Continuous visibility of objects and actions encourages to eliminate “out of sight, out of mind” problem

Concurrent Performance of Functions:-

Graphic systems may do two or more things at one time. Multiple programs may run simultaneously. It may process background tasks (cooperative multitasking) or preemptive multitasking. Data may also be transferred between programs. It may be temporarily stored on a “clipboard” for later transfer or be automatically swapped between programs.

List and explain the characteristics of Graphical user interface.

Characteristics of the Graphical User Interface:-

Sophisticated Visual Presentation:-

Visual presentation is the visual aspect of the interface. It is what people see on the screen. The sophistication of a graphical system permits displaying lines, including drawings and icons. It also permits the displaying of a variety of character fonts, including different sizes and styles. The meaningful interface elements visually presented to the user in a graphical system include windows (primary, secondary, or dialog boxes), menus (menu bar, pulldown, pop-up, cascading), icons to represent objects such as programs or files, assorted screen-based controls (text boxes, list boxes, combination boxes, settings, scroll bars, and buttons), and a mouse pointer and cursor. The objective is to reflect visually on the screen the real world of the user as realistically, meaningfully, simply, and clearly as possible.

 Pick-and-Click Interaction:-

To identify a proposed action is commonly referred to as pick, the signal to perform an action as click. The primary mechanism for performing this pick-and-click is most often the mouse and its buttons and the secondary mechanism for performing these selection actions is the keyboard.

Restricted Set of Interface Options:-

The array of alternatives available to the user is what is presented on the screen or what may be retrieved through what is presented on the screen, nothing less, and nothing more. This concept fostered the acronym WYSIWYG.

Visualization:-

Visualization is a cognitive process that allows people to understand information that is difficult to perceive, because it is either too voluminous or too abstract. The goal is not necessarily to reproduce a realistic graphical image, but to produce one that conveys the most relevant information. Effective visualizations can facilitate mental insights, increase productivity, and foster faster and more accurate use of data.

 Object Orientation:-

  • A graphical system consists of objects and actions. Objects are what people see on the screen as a single unit.
  • Objects can be composed of subobjects .For example, an object may be a document and its subobjects may be a paragraph, sentence, word, and letter.
  • Objects are divided into three meaningful classes as Data objects, which present information, container objects to hold other objects and Device objects, represent physical objects in the real world.
  • Objects can exist within the context of other objects, and one object may affect the way another object appears or behaves. These relationships are called collections, constraints, composites, and containers. 

Use of Recognition Memory:-

Continuous visibility of objects and actions encourages to eliminate “out of sight, out of mind” problem

Concurrent Performance of Functions:-

Graphic systems may do two or more things at one time. Multiple programs may run simultaneously. It may process background tasks (cooperative multitasking) or preemptive multitasking. Data may also be transferred between programs. It may be temporarily stored on a “clipboard” for later transfer or be automatically swapped between programs.

Describe the issues of Knowledge Representation.

1. Important attributes :- There are two attributes shown in the diagram, instance and isa. Since these attributes support property of inheritance, they are of prime importance. 

2. Relationships among attributes  :- Basically, the attributes used to describe objects are nothing but the entities. However, the attributes of an object do not depend on the encoded specific knowledge. 

3. Choosing the granularity of representation :- While deciding the granularity of representation, it is necessary to know the following: 

i. What are the primitives and at what level should the knowledge be represented? 

ii. What should be the number (small or large) of low-level primitives or high-level facts? 

High-level facts may be insufficient to draw the conclusion while Low-level primitives may require a lot of storage. For example: Suppose that we are interested in following facts: John spotted Alex. 

Now, this could be represented as "Spotted (agent(John), object (Alex))" 

Such a representation can make it easy to answer questions such as: Who spotted Alex? 

Suppose we want to know : "Did John see Sue?" Given only one fact, user cannot discover that answer. 

Hence, the user can add other facts, such as "Spotted (x, y) → saw (x, y)" 

4. Representing sets of objects :- There are some properties of objects which satisfy the condition of a set together but not as individual; 

Example: Consider the assertion made in the sentences: "There are more sheep than people in Australia", and "English speakers can be found all over the world." 

These facts can be described by including an assertion to the sets representing people, sheep, and English. 

5. Finding the right structure as needed :- To describe a particular situation, it is always important to find the access of right structure. This can be done by selecting an initial structure and then revising the choice.

While selecting and reversing the right structure, it is necessary to solve following problem statements. 

They include the process on how to: 

• Select an initial appropriate structure. 

• Fill the necessary details from the current situations. 

• Determine a better structure if the initially selected structure is not appropriate to fulfill other conditions. 

• Find the solution if none of the available structures is appropriate. 

• Create and remember a new structure for the given condition. 

• There is no specific way to solve these problems, but some of the effective knowledge representation techniques have the potential to solve them.

Outline the ID3 Decision Tree Learning method.

ID3 Steps :-

1. Calculate the Information Gain of each feature. 

2. Considering that all rows don’t belong to the same class, split the dataset S into subsets using the feature for which the Information Gain is maximum. 

3. Make a decision tree node using the feature with the maximum Information gain. 

4. If all rows belong to the same class, make the current node as a leaf node with the class as its label.

5. Repeat for the remaining features until we run out of all features, or the decision tree has all leaf nodes

ID3 uses a top-down greedy approach to build a decision tree. In simple words, the top-down approach means that we start building the tree from the top and the greedy approach means that at each iteration we select the best feature at the present moment to create a node.

ID3 uses Information Gain or just Gain to find the best feature.

Information Gain calculates the reduction in the entropy and measures how well a given feature separates or classifies the target classes. The feature with the highest Information Gain is selected as the best one.

In simple words, Entropy is the measure of disorder and the Entropy of a dataset is the measure of disorder in the target feature of the dataset. In the case of binary classification (where the target column has only two types of classes) entropy is 0 if all values in the target column are homogenous(similar) and will be 1 if the target column has equal number values for both the classes.

We denote our dataset as S, entropy is calculated as: Entropy(S) = - ∑ pᵢ * log₂(pᵢ) ; i = 1 to n

where, n is the total number of classes in the target column (in our case n = 2 i.e YES and NO) pᵢ is the probability of class ‘i’ or the ratio of “number of rows with class i in the target column” to the “total number of rows” in the dataset.

Information Gain for a feature column A is calculated as: IG(S, A) = Entropy(S) - ∑((|Sᵥ| / |S|) * Entropy(Sᵥ))

where Sᵥ is the set of rows in S for which the feature column A has value v, |Sᵥ| is the number of rows in Sᵥ and likewise |S| is the number of rows in S.

What is Constructor Overloading?

Constructor overloading is a concept of having more than one constructor with different parameters list, in such a way so that each constructor performs a different task. For e.g. Vector class has 4 types of constructors. If you do not want to specify the initial capacity and capacity increment then you can simply use default constructor of Vector class like this Vector v = new Vector(); however if you need to specify the capacity and increment then you call the parameterized constructor of Vector class with two int arguments like this: Vector v= new Vector(10, 5);

Constructor overloading Program :-

  1. public class Student {  
  2. //instance variables of the class  
  3. int id;  
  4. String name;  
  5.   
  6. Student(){  
  7. System.out.println("this a default constructor");  
  8. }  
  9.   
  10. Student(int i, String n){  
  11. id = i;  
  12. name = n;  
  13. }  
  14.   
  15. public static void main(String[] args) {  
  16. //object creation  
  17. Student s = new Student();  
  18. System.out.println(" Default Constructor values:  ");  
  19. System.out.println("Student Id : "+s.id + " Student Name : "+s.name);  
  20.   
  21. System.out.println(" Parameterized Constructor values:  ");  
  22. Student student = new Student(10, "David");  
  23. System.out.println("Student Id : "+student.id + " Student Name : "+student.name);  
  24. }  
  25. }  

Output :-

this a default constructor


Default Constructor values:


Student Id : 0

Student Name : null


Parameterized Constructor values: 


Student Id : 10

Student Name : David

Explain properties of structure steel. 

The properties of steel required for engineering design may be classified as 

A . Physical properties 

B . Mechanical properties 

A . Physical properties:-                                                          The Physical properties of steel are function of its  metallurgy and manufacturing process. Some of important physical properties of structure steel are listed below                                       SI.NO.   Physical properties      Magnitude    1.       Modulus of elasticity       2×10^5                                   (E)                             mpa

 2.   Modulus of Rigidity          0.769 × 10^5                      (R)                                    mpa

 3.   Poisson's Ratio           0.3-Elastic range                                                0.5 plastic range 

 4. Density or unit mass         7850 kg/m^3              of steel (Raw)   

 5. Coefficient of thermal          12× 10^-6/                  expansion                  degree celsus


  B. Mechanical properties:-                                         The  alloys and the heat treatment  used in the production of steel results in having different properties and strength. The mechanical properties are listen  as follows. 

  1.     Tensile  strength                                      2.     Hardness                                                   3.      Notch Toughness                               4.      Corrosion  Resistance                            5.        Fatigue strength 


Describe Factors Affecting Dry Weather Flow (DWF)?

The dry weather flow or the quantity of sanitary sewage depends upon the following factors:

• Rate of water supply 
• Population growth  ​​​
• Type of area served ​​​​​​
• Infiltration of ground water 

​​​​​​​​​​​​​​​​​​​​Rate of water supply   

  1.  The rate of water supply to a city or town is a expressed so many capital /day.
  2. The quantity of waste water entering the sewers would be less than the total quantity of water supplied. 
  3. This extra  water that enter the sewer can be assumed to approximately equal to the water lost in consumption. 

 Population growth​​​​​​​

  1.   The quantity of sanitary sewage  directly depend on the population. 
  2. The sewage quantity with will be produced in the town due to future development of the town and  population should be taken into account and possible accurate result should be obtained. 


 Types of area served 


  •  The quantity of sanitary sewage also depend on the type of area to be served it is residential,  industrial or  commercial. 
  • The quantity of sewage produced in residential areas directly depend on the quantity of water supply to the area. 
  • The quantity is obtained by multiplying the population with this factor. The quantity of sewage produced by various industries depend on the various industries,  and it is different for each industry.

Infiltration of Ground Water 

  1.  Groundwater or sub-soil water may Infiltrate intothe sewers through  the leaky  joints.
  2. Both Infiltration as well as ex- filtration are undesirable and take place due to imperfect joints. 


QUESTION----       Define data structure ? Explain Needs and   classification of data structures.

  • Data can be organized in many different ways. The logical or mathematical model of a organization of data is called a Data Structure
  •  A data structure is a collection of data values, the relationships among them, and the functions or operations that can be applied to the data,


NEEDS OF DATA  STRUCTURE--

  • The computer are electronic data processing machine. In order to solve particular problem we need to know:

             1-- How to represent data in computers?

             2-- How to access them?

             3-- What are the steps we need to perform to get the needed output

     These task can be achieved with the knowledge of data structure and algorithm.


CLASSIFICATION OF DATA STRUCTURE---

  • Data structure are classified into PRIMITIVE and NON-PRIMITIVE data structures

               1-> PRIMITIVE DATA STRUCTURE  

                      --   These are the fundamentals standards data types.

                      --  These are used to represent single values .

                      example- int, float, char, double

               2->  NON-PRIMITIVE DATA STRUCTURE

                      -- These are derived from primitive data types

                      --  Used to store group of values

                      example- arrays, stacks, queues, trees etc.

  • Based on the structures and arrangement of data, non-primitive data structures are further classified into linear and non-linear.                   

            LINEAR DATA STRUCTURE--

           >  A data structure is said to be linear if its elements form a sequence or a linear list

           > In linear data structures, the data is arranged in a linear fashion although the way they are stored in memory need not be sequential

            example- Arrays, linked list etc

            NON-PRIMITIVE DATA STRUCTURE--

           > A data structure is said to be a non-linear if the data is not arranged in sequence. 

           > The insertion and deletion of data is therefore not possible in a linear fashion

           example- trees, graphs

Why do we need dynamic memory allocation techniques? Explain the functions available for allocating memory dynamically.

DYNAMIC MEMORY ALLOCATION----

  •  It refers to performing manual management for dynamic memory allocation using standard library functions such as malloc, realoc, calloc and free.
  • The size of array initially declared can be sometimes insufficient or sometimes more than required but dynamic memory allocation allows a program to obtain more memory space, while running or to release space when not required.

FUNCTIONS OF DYNAMIC MEMORY ALLOCATION----

  • There are four standard library functions under “stdlib.h” for dynamic memory allocation. 
  1. malloc()
  2. calloc()
  3. realloc()
  4. free()             

=>   malloc() – It allocates requested size of bytes and returns a pointer first byte of allocated space.

                      Syntax : ptr=(data_type *)malloc(bysize);

                      Ex : (int*)malloc(100*sizeof(int)) 

=>   calloc() – Allocates spaces for array elements, initializes to zero and then returns a pointer to memory.

                      Syntax : ptr=(data_type*)calloc(n,element_size);

                      Ex : ptr=(float*)calloc(25,sizeof(float))

=>   realloc() – Changes the size of the previously allocated space according to the requirement.

                      Syntax : ptr=realloc(ptr,newsize);

=>   free() – It deallocates the previously allocated space.

                     Syntax – free(ptr);

Explain declaration, initialization of One dimensional and Two dimensional arrays.

==> One Dimensional Array---

               Declaration::

                      Syntax: data_type array_name[array_size];

                                   where, data_type can be int, float or char.

                                   array_name is the name of the array.

                                   array_size indicates number of elements in the array.

                                   For ex: int age[5];

             Initialization::

                          Syntax: data_type array_name[array_size]={v1,v2,v3};

                                       where, v1, v2, v3 are the values

                                       For ex: int age[5]={2,4,34,25,18};

==> Two Dimensional Array----

             Declaration::

                            Syntax: data_type array_name[array_size][array_size];

                                          where, first index shows the row number of the element and

                                                         second index shows the coulmn number of the element

            Initialisation::

                             Syntax: data_type array_name[array_size][array_size]={V1,V2,V3,.....Vn};

                                           where, V1, V2, V3,......,Vn are the values

                             For ex: int matrix[2][3]={2,4,56,3,6};

Explain Assignment Techniques 

The assignment techniques are as follows:

  1. All or Nothing assignment 
  2. Capacity restraint assignment 
  3. Incremental traffic assignment 
  4.  Multiple routes assignment 
  5.  Diversion curves 
  6. User equilibrium assignment 
  7. Dynamic assignment 
  8. Probabilistic assignment 

 1. All or Nothing assignment:-

            In this method the trips from any origin zone to any destination zone are loaded on a single minimum cost, path  between them. This model is unrealistic as only one path between every origin to destination pair us utilized even if there is another path with same or nearly same travel cost. This model may also be used to identify the desired path. 

 2. Capacity restraint assignment:-

     It is a process in which the travel resistance of a link is increased according to a relation between the practical capacity of link and volume assigned to link. This system clearly restraint the number of vehicles that can be use any particular corridor, if the assigned volume are beyond the capacity of the network  and redistribute the traffic to realistic alternatives paths. 

3. Incremental assignment:-

  Incremental assignment is a process in which fraction of traffic volumes are assigned in steps. In each step, a fixed proportion of total demand is assigned based on All or Nothing assignment. Also, Incremental assignment is influenced by the order in which volumes for origin to destination pairs are assigned,  the possibility of additional bias in results. 

4. Multiple route assignment:-

    This method of traffic assignment of this method was developed by Burell. The main assumption of this method is that trip - maker does not know the correct travel time. The correct travel time is considered bevthe mean travel time. 


Factors controlling Alignment 

The various factors control the alignment are as follows:-

  1. Obligatory points 
  2. Traffic 
  3. Geometric Design 
  4. Economics 
  5. Other considerations

1. Obligatory points 

         These are the control points governing the highway alignment. This point are classified by into two categories.

  1. Points through which the alignment should pass
  2. Points through which the alignment should not pass

1. Points through which the alignment should pass :-

  • Bridge site : The Bridge can be located only where the river has straight and permanent path and also where the abutment and pier  an be strongly founded. 

2. Points through which the alignment should not  pass 

  • Religious places: These has been protected by the law from being acquired for any purpose. 

2. Traffic 

  • The alignment should suit the traffic requirements . Based on the origin to destination data of the area the desire line should be drawn.  The new alignment should be drawn keeping in view the desire lines, traffic flow patterns. 

3. Geometric Design 

  • Geometric design factors such as gradient,  radius of curve,  sight distance etc, also governs the alignment of the highway.  To keep the radius of curve minimum,  it may be required to change the alignment of the highway. 

4. Economics 

  • The alignment finalized should be economical.  All the three cost I.e. construction,  maintenance,  and operating cost should be minimum. 

5. Other  considerations 

  • The various other factors that govern the alignment are drainage considerations,  political considerations and monotony. The vertical alignment is often guided by drainage considerations such as sub surface drainage, water level, seepage flow,  and high flood levels. 

Explain Evolution of storage architecture with neat diagram?

➢ Historically, organizations had centralized computers (mainframe) and information storage devices (tape reels and disk packs) in their data center.
➢ The evolution of open systems and the affordability and ease of deployment that they offer made it possible for business units/departments to have their own servers and storage.
➢ In earlier implementations of open systems, the storage was typically internal to the server. This approach is referred to as server-centric storage architecture (see Fig 1.4 [a]).
➢ In this server-centric storage architecture, each server has a limited number of storage devices, and any administrative tasks, such as maintenance of the server or increasing storage capacity, might result in unavailability of information.
➢ The rapid increase in the number of departmental servers in an enterprise resulted in unprotected, unmanaged, fragmented islands of information and increased capital and operating expenses.
➢ To overcome these challenges, storage evolved from server-centric to information-centric architecture.
➢ In information-centric architecture, storage devices are managed centrally and independent of servers.
➢ These centrally-managed storage devices are shared with multiple servers.
➢ When a new server is deployed in the environment, storage is assigned from the same shared storage devices to that server.
➢ The capacity of shared storage can be increased dynamically by adding more storage devices without impacting information availability.
➢ In this architecture, information management is easier and cost-effective.
➢ Storage technology and architecture continues to evolve, which enables organizations to consolidate, protect, optimize, and leverage their data to achieve the highest return on information assets.

Discuss the key characteristics of data centre with neat diagram?

Key characteristics of data center elements are: 1) Availability: All data center elements should be designed to ensure accessibility. The inability of users to access data can have a significant negative impact on a business.
2) Security: Polices, procedures, and proper integration of the data center core elements that will prevent unauthorized access to information must be established. Specific mechanisms must enable servers to access only their allocated resources on storage arrays.
3) Scalability: Data center operations should be able to allocate additional processing capabilities (eg: servers, new applications, and additional databases) or storage on demand, without interrupting business operations. The storage solution should be able to grow with the business.
4) Performance: All the core elements of the data center should be able to provide optimal performance and service all processing requests at high speed. The infrastructure should be able to support performance requirements.
5) Data integrity: Data integrity refers to mechanisms such as error correction codes or parity bits which ensure that data is written to disk exactly as it was received. Any variation in data during its retrieval implies corruption, which may affect the operations of the organization.
6) Capacity: Data center operations require adequate resources to store and process large amounts of data efficiently. When capacity requirements increase, the data center must be able to provide additional capacity without interrupting availability, or, at the very least, with minimal disruption. Capacity may be managed by reallocation of existing resources, rather than by adding new resources.
7) Manageability: A data center should perform all operations and activities in the most efficient manner. Manageability can be achieved through automation and the reduction of human (manual) intervention in common tasks.

What is protocol? Explain Interface Protocol used for host to storage communications?

➢ A protocol enables communication between the host and storage.
➢ Protocols are implemented using interface devices (or controllers) at both source and destination.
➢ The popular interface protocols used for host to storage communications are: i. Integrated Device Electronics/Advanced Technology Attachment (IDE/ATA) ii. Small Computer System Interface (SCSI), iii. Fibre Channel (FC) iv. Internet Protocol (IP)

IDE/ATA and Serial ATA:
➢ IDE/ATA is a popular interface protocol standard used for connecting storage devices, such as disk drives and CD-ROM drives.
➢ This protocol supports parallel transmission and therefore is also known as Parallel ATA (PATA) or simply ATA.
➢ IDE/ATA has a variety of standards and names.
➢ The Ultra DMA/133 version of ATA supports a throughput of 133 MB per second.
➢ In a master-slave configuration, an ATA interface supports two storage devices per connector.
➢ If performance of the drive is important, sharing a port between two devices is not recommended.
➢ The serial version of this protocol is known as Serial ATA (SATA) and supports single bit serial transmission.
➢ High performance and low cost SATA has replaced PATA in newer systems.
➢ SATA revision 3.0 provides a data transfer rate up to 6 Gb/s.

SCSI and Serial SCSI:
➢ SCSI has emerged as a preferred connectivity protocol in high-end computers.
➢ This protocol supports parallel transmission and offers improved performance, scalability, and compatibility compared to ATA.
➢ The high cost associated with SCSI limits its popularity among home or personal desktop users.
➢ SCSI supports up to 16 devices on a single bus and provides data transfer rates up to 640 MB/s.
➢ Serial attached SCSI (SAS) is a point-to-point serial protocol that provides an alternative to parallel SCSI.
➢ A new version of serial SCSI (SAS 2.0) supports a data transfer rate upto 6Gb/s.

Fibre Channel (FC):
➢ Fibre Channel is a widely used protocol for high-speed communication to the storage device.
➢ Fibre Channel interface provides gigabit network speed.
➢ It provides a serial data transmission that operates over copper wire and optical fiber.
➢ The latest version of the FC interface (16FC) allows transmission of data up to 16 Gb/s. Internet Protocol (IP):
➢ IP is a network protocol that has been traditionally used for host-to-host traffic.
➢ With the emergence of new technologies, an IP network has become a viable option for hostto-storage communication.
➢ IP offers several advantages: ✓ cost ✓ maturity ✓ enables organizations to leverage their existing IP-based network.
➢ iSCSI and FCIP protocols are common examples that leverage IP for host-to-storage communication.

Explain components of intelligent storage system?

➢ Intelligent Storage Systems are feature-rich RAID arrays that provide highly optimized 

I/O processing capabilities.

➢ These storage systems are configured with a large amount of memory (called cache) and 

multiple I/O paths and use sophisticated algorithms to meet the requirements of 

performance-sensitive applications.

➢ An intelligent storage system consists of four key components (Refer Fig 1.21):

Fig 1.21 Components of an Intelligent Storage System

1.14.1 Front End

➢ The front end provides the interface between the storage system and the host.

➢ It consists of two components:

i. Front-End Ports

ii. Front-End Controllers.

✓ Front End

✓ Cache

✓ Back end

✓ Physical disks


Front End

➢ The front end provides the interface between the storage system and the host.

➢ It consists of two components:

i. Front-End Ports

ii. Front-End Controllers.

➢ A front end has redundant controllers for high availability, and each controller contains 

multiple front-end ports that enable large numbers of hosts to connect to the intelligent 

storage system.

➢ Each front-end controller has processing logic that executes the appropriate transport 

protocol, such as Fibre Channel, iSCSI, FICON, or FCoE for storage connections.

➢ Front-end controllers route data to and from cache via the internal data bus.

➢ When the cache receives the write data, the controller sends an acknowledgment message 

back to the host.


Cache

➢ Cache is semiconductor memory where data is placed temporarily to reduce the time 

required to service I/O requests from the host.

➢ Cache improves storage system performance by isolating hosts from the mechanical 

delays associated with rotating disks or hard disk drives (HDD).

➢ Rotating disks are the slowest component of an intelligent storage system. Data access on 

rotating disks usually takes several millisecond because of seek time and rotational latency.

➢ Accessing data from cache is fast and typically takes less than a millisecond.

➢ On intelligent arrays, write data is first placed in cache and then written to disk.


Back End

➢ The back end provides an interface between cache and the physical disks.

➢ It consists of two components:

i. Back-end ports

ii. Back-end controllers.

➢ The back end controls data transfers between cache and the physical disks.

➢ From cache, data is sent to the back end and then routed to the destination disk.

➢ Physical disks are connected to ports on the back end.

➢ The back end controller communicates with the disks when performing reads and writes 

and also provides additional, but limited, temporary data storage.

➢ The algorithms implemented on back-end controllers provide error detection and 

correction, and also RAID functionality.

➢ For high data protection and high availability, storage systems are configured with dual 

controllers with multiple ports.


Physical Disk

➢ A physical disk stores data persistently.

➢ Physical disks are connected to the back-end storage controller and provide persistent data 

storage.

➢ Modern intelligent storage systems provide support to a variety of disk drives with 

different speeds and types, such as FC, SATA, SAS, and flash drives.

➢ They also support the use of a mix of flash, FC, or SATA within the same array.


What is a file system? Explain the process mapping user files to disk storage?

File System

➢ A file is a collection of related records or data stored as a unit with a name.

➢ A file system is a hierarchical structure of files.

➢ A file system enables easy access to data files residing within a disk drive, a disk partition, or 

a logical volume.

➢ It provides users with the functionality to create, modify, delete, and access files.

➢ Access to files on the disks is controlled by the permissions assigned to the file by the owner, 

which are also maintained by the file system.

➢ A file system organizes data in a structured hierarchical manner via the use of directories, 

which are containers for storing pointers to multiple files.

➢ All file systems maintain a pointer map to the directories, subdirectories, and files that are 

part of the file system.

➢ Examples of common file system are:


✓ NT File System (NTFS) for Microsoft Windows

✓ UNIX File System (UFS) for UNIX

✓ Extended File System (EXT2/3) for Linux


➢ The file system also includes a number of other related records, which are collectively called 

the metadata.

➢ For example, the metadata in a UNIX environment consists of the superblock, the inodes, 

and the list of data blocks free and in use.

➢ A superblock contains important information about the file system, such as the file system 

type, creation and modification dates, size, and layout.

➢ An inode is associated with every file and directory and contains information such as the file 

length, ownership, access privileges, time of last access/modification, number of links, and 

the address of the data.

➢ A file system block is the smallest “unit” allocated for storing data.


➢ The following list shows the process of mapping user files to the disk storage subsystem with 

an LVM (see Fig 1.8)

1. Files are created and managed by users and applications.

2. These files reside in the file systems.

3. The file systems are mapped to file system blocks.

4. The file system blocks are mapped to logical extents of a logical volume.

5. These logical extents in turn are mapped to the disk physical extents either by the 

operating system or by the LVM.

6. These physical extents are mapped to the disk sectors in a storage subsystem.

If there is no LVM, then there are no logical extents. Without LVM, file system blocks are 

directly mapped to disk sectors.

➢ The file system tree starts with the root directory. The root directory has a number of 

subdirectories.

➢ A file system can be either :

✓ a journaling file system

✓ a nonjournaling file system.


Explain the components of SAN?

Components of Storage Area Network (SAN) involves 3 basic components:


(a). Server 

(b). Network Infrastructure

(c). Storage

The above elements are classified into following elements like,


(1). Node port

(2). Cables

(3). Interconnection Devices

(4). Storage Array, and

(5). SAN Management Software 

These are explained as following below.


1. Node port:

In fiber channel, devices like,


Host

Storage

Tape Libraries are referred as nodes

Nodes consists of ports for transmission between other nodes. Ports operate in Full-duplex data transmission mode with transmit(Tx) and Receive(Rx) link.


2. Cables:

SAN implements optical fiber cabling. Copper cables are used for short distance connectivity and optical cables for long distance connection establishment.

There are 2 types of optical cables: Multi-mode fiber and Single-mode fiber are as given below.


Multi-mode fiber:

Also called MMF, as it carries multiple rays of light projected at different angles simultaneously onto the core of the cable. In MMF transmission, light beam travelling inside the cable tend to disperse and collide. This collision, weakens the signal strength after it travels certain distance, and it is called modal dispersion.

MMF cables are used for distance up-to 500 meters because of signal degradation(attenuation) due to modal dispersion.


Single-mode fiber:

Also called SMF, as it carries a single beam of light through the core of the fiber. Small core in the cable reduces modal dispersion. SMF cables are used for distance up-to 10 kilometers due to less attenuation. SMF is costlier than MMF.

Other than these cables, Standard Connectors (SC) and Lucent Connectors (LC) are commonly used fiber cables with data transmission speed up-to 1 Gbps and 4 Gbps respectively. Small Form-factor Pluggable (SFP) is an optical transceiver used in optical communication with transmission speed up-to 10 Gbps.


3. Interconnection Devices:

The commonly used interconnection devices in SAN are:


Hubs

Switches and

Directors

Hubs are communication devices used in fiber cable implementations. They connect nodes in loop or star topology.

Switches are more intelligent than hubs. They directly route data from one port to other. They are cheap and their performance is better than hubs.

Directors are larger than switches, used for data center implementations. Directors have high fault tolerance and high port count than switches.


4. Storage Array:


A disk array also called a storage array, is a data storage system used for block-based storage, file-based storage, or object storage. The term is used to describe dedicated storage hardware that contains spinning hard disk drives (HDDs) or solid-state drives (SSDs).


The fundamental purpose of a SAN is to provide host access to storage resources. SAN storage implementations provides:


high availability and redundancy,

improved performance,

business continuity and

multiple host connectivity.

5. SAN Management Software:

This software manages the interface between the host, interconnection devices, and storage arrays. It includes key management functions like mapping of storage devices, switches, and logical partitioning of SAN, called zoning. It also manages the important components of SAN like storage devices and interconnection devices.

What is RAID? Explain the Implementation of RAID?

Redundant Arrays of Inexpensive Disks (RAID)


➢ RAID is the use of small-capacity, inexpensive disk drives as an alternative to largecapacity drives common on mainframe computers.

➢ Later RAID has been redefined to refer to independent disks to reflect advances in the storage technology.


RAID Implementation Methods

➢ The two methods of RAID implementation are:

1. Hardware RAID.

2. Software RAID.


Hardware RAID -


➢ In hardware RAID implementations, a specialized hardware controller is implemented either 

on the host or on the array.

➢ Controller card RAID is a host-based hardware RAID implementation in which a 

specialized RAID controller is installed in the host, and disk drives are connected to it.

➢ Manufacturers also integrate RAID controllers on motherboards.

➢ A host-based RAID controller is not an efficient solution in a data center environment with a 

large number of hosts.

➢ The external RAID controller is an array based hardware RAID.

➢ It acts as an interface between host and disks.

➢ It presents storage volumes to the host, and the host manages these volumes as physical 

drives.

➢ The key functions of the RAID controllers are as follows:

✓ Management and control of disk aggregations

✓ Translation of I/O requests between logical disks and physical disks

✓ Data regeneration in the event of disk failures


Software RAID -


➢ Software RAID uses host-based software to provide RAID functions.

➢ It is implemented at the operating-system level and does not use a dedicated hardware 

controller to manage the RAID array.

➢ Advantages when compared to Hardware RAID:

✓ cost

✓ simplicity benefits

➢ Limitations:

✓ Performance: Software RAID affects overall system performance. This is due to 

additional CPU cycles required to perform RAID calculations.

✓ Supported features: Software RAID does not support all RAID levels.

✓ Operating system compatibility: Software RAID is tied to the host operating system; 

hence, upgrades to software RAID or to the operating system should be validated for 

compatibility. This leads to inflexibility in the data-processing environment.

Explain 3 types of RAID Techniques?

➢ There are three RAID techniques

1. striping

2. mirroring

3. parity


Striping -


➢ Striping is a technique to spread data across multiple drives (more than one) to use the drives 

in parallel.

➢ All the read-write heads work simultaneously, allowing more data to be processed in a shorter 

time and increasing performance, compared to reading and writing from a single disk.

➢ Within each disk in a RAID set, a predefined number of contiguously addressable disk 

blocks are defined as a strip.

➢ The set of aligned strips that spans across all the disks within the RAID set is called a stripe.

➢ Fig shows physical and logical representations of a striped RAID set.


➢ Strip size (also called stripe depth) describes the number of blocks in a strip and is the 

maximum amount of data that can be written to or read from a single disk in the set.

➢ All strips in a stripe have the same number of blocks.

✓ Having a smaller strip size means that data is broken into smaller pieces while spread 

across the disks.

➢ Stripe size is a multiple of strip size by the number of data disks in the RAID set.

✓ Eg: In a 5 disk striped RAID set with a strip size of 64 KB, the stripe size is 320KB 

(64KB x 5).

➢ Stripe width refers to the number of data strips in a stripe.

➢ Striped RAID does not provide any data protection unless parity or mirroring is used.


2 Mirroring

➢ Mirroring is a technique whereby the same data is stored on two different disk drives, 

yielding two copies of the data.

➢ If one disk drive failure occurs, the data is intact on the surviving disk drive (see Fig 1.12) 

and the controller continues to service the host’s data requests from the surviving disk of a 

mirrored pair.

➢ When the failed disk is replaced with a new disk, the controller copies the data from the 

surviving disk of the mirrored pair.

➢ This activity is transparent to the host.

➢ Advantages:

✓ complete data redundancy,

✓ mirroring enables fast recovery from disk failure.

✓ data protection

➢ Mirroring is not a substitute for data backup. Mirroring constantly captures changes in the 

data, whereas a backup captures point-in-time images of the data.

➢ Disadvantages:

✓ Mirroring involves duplication of data — the amount of storage capacity needed is twice the amount of data being stored.

✓ Expensive

Parity

➢ Parity is a method to protect striped data from disk drive failure without the cost of 

mirroring.

➢ An additional disk drive is added to hold parity, a mathematical construct that allows recreation of the missing data.

➢ Parity is a redundancy technique that ensures protection of data without maintaining a full 

set of duplicate data.

➢ Calculation of parity is a function of the RAID controller.

➢ Parity information can be stored on separate, dedicated disk drives or distributed across all the 

drives in a RAID set.

➢ Fig shows a parity RAID set.

➢ The first four disks, labeled “Data Disks,” contain the data. The fifth disk, labeled “Parity 

Disk,” stores the parity information, which, in this case, is the sum of the elements in each 

row.

➢ Now, if one of the data disks fails, the missing value can be calculated by subtracting the sum 

of the rest of the elements from the parity value.

➢ Here, computation of parity is represented as an arithmetic sum of the data. However, parity 

calculation is a bitwise XOR operation


Explain levels of Raid with neat diagram?

RAID Levels

➢ RAID Level selection is determined by below factors:

✓ Application performance

✓ data availability requirements

✓ cost

➢ RAID Levels are defined on the basis of:

✓ Striping

✓ Mirroring

✓ Parity techniques

➢ Some RAID levels use a single technique whereas others use a combination of techniques.

➢ Table shows the commonly used RAID levels 


1 RAID 0

➢ RAID 0 configuration uses data striping techniques, where data is striped across all the disks 

within a RAID set. Therefore it utilizes the full storage capacity of a RAID set.

➢ To read data, all the strips are put back together by the controller.

➢ Fig 1.14 shows RAID 0 in an array in which data is striped across five disks.

➢ When the number of drives in the RAID set increases, performance improves because more 

data can be read or written simultaneously.


RAID 1

➢ RAID 1 is based on the mirroring technique.

➢ In this RAID configuration, data is mirrored to provide fault tolerance (see Fig 1.15). A

➢ RAID 1 set consists of two disk drives and every write is written to both disks.

➢ The mirroring is transparent to the host.

➢ During disk failure, the impact on data recovery in RAID 1 is the least among all RAID 

implementations. This is because the RAID controller uses the mirror drive for data recovery.

➢ RAID 1 is suitable for applications that require high availability and cost is no constraint.


Nested RAID

➢ Most data centers require data redundancy and performance from their RAID arrays.

➢ RAID 1+0 and RAID 0+1 combine the performance benefits of RAID 0 with the redundancy 

benefits of RAID 1.

➢ They use striping and mirroring techniques and combine their benefits.

➢ These types of RAID require an even number of disks, the minimum being four.


RAID 3

➢ RAID 3 stripes data for high performance and uses parity for improved fault tolerance.

➢ Parity information is stored on a dedicated drive so that data can be reconstructed if a drive 

fails. For example, of five disks, four are used for data and one is used for parity.

➢ RAID 3 always reads and writes complete stripes of data across all disks, as the drives operate 

in parallel. There are no partial writes that update one out of many strips in a stripe.

➢ RAID 3 provides good bandwidth for the transfer of large volumes of data. RAID 3 is used in 

applications that involve large sequential data access, such as video streaming.


RAID 4

➢ RAID 4 stripes data for high performance and uses parity for improved fault tolerance. Data 

is striped across all disks except the parity disk in the array.

➢ Parity information is stored on a dedicated disk so that the data can be rebuilt if a drive fails. 

Striping is done at the block level.

➢ Unlike RAID 3, data disks in RAID 4 can be accessed independently so that specific data 

elements can be read or written on single disk without read or write of an entire stripe. RAID 

4 provides good read throughput and reasonable write throughput.


RAID 5

➢ RAID 5 is a versatile RAID implementation.

➢ It is similar to RAID 4 because it uses striping. The drives (strips) are also independently 

accessible.

➢ The difference between RAID 4 and RAID 5 is the parity location. In RAID 4, parity is 

written to a dedicated drive, creating a write bottleneck for the parity disk

➢ In RAID 5, parity is distributed across all disks. The distribution of parity in RAID 5 

overcomes the Write bottleneck. Below Figure illustrates the RAID 5 implementation.

➢ Fig 1.18 illustrates the RAID 5 implementation.

➢ RAID 5 is good for random, read-intensive I/O applications and preferred for messaging, data 

mining, medium-performance media serving, and relational database management system 

(RDBMS) implementations, in which database administrators (DBAs) optimize data access.


 RAID 6

➢ RAID 6 includes a second parity element to enable survival in the event of the failure of two 

disks in a RAID group. Therefore, a RAID 6 implementation requires at least four disks.

➢ RAID 6 distributes the parity across all the disks. The write penalty in RAID 6 is more than 

that in RAID 5; therefore, RAID 5 writes perform better than RAID 6. The rebuild operation 

in RAID 6 may take longer than that in RAID 5 due to the presence of two parity sets.

Explain the structure of cache and operations on cache?

Structure Of Cache -


➢ Cache is organized into pages, which is the smallest unit of cache allocation. The size of a 

cache page is configured according to the application I/O size.

➢ Cache consists of the data store and tag RAM.

➢ The data store holds the data whereas the tag RAM tracks the location of the data in the 

data store (see Fig 1.22) and in the disk.

➢ Entries in tag RAM indicate where data is found in cache and where the data belongs on 

the disk.

➢ Tag RAM includes a dirty bit flag, which indicates whether the data in cache has been 

committed to the disk.

➢ It also contains time-based information, such as the time of last access, which is used to 

identify cached information that has not been accessed for a long period and may be freed 

up.


Read Operation with Cache

➢ When a host issues a read request, the storage controller reads the tag RAM to determine 

whether the required data is available in cache.

➢ If the requested data is found in the cache, it is called a read cache hit or read hit and 

data is sent directly to the host, without any disk operation (see Fig 1.23[a]).This provides 

a fast response time to the host (about a millisecond).

➢ If the requested data is not found in cache, it is called a cache miss and the data must be read from the disk. The backend controller accesses the appropriate disks and retrieves the requested data. Data is then placed in cache and is finally sent to the host thorugh the front end controller.

➢ Cache misses increase I/O response time.

➢ A Pre-fetch, or Read-ahead, algorithm is used when read requests are sequential. In a 

sequential read request, a contiguous set of associated blocks is retrieved. Several other 

blocks that have not yet been requested by the host can be read from the disk and placed 

into cache in advance. When the host subsequently requests these blocks, the read 

operations will be read hits.

➢ This process significantly improves the response time experienced by the host.

➢ The intelligent storage system offers fixed and variable prefetch sizes.

➢ In fixed pre-fetch, the intelligent storage system pre-fetches a fixed amount of data. It is 

most suitable when I/O sizes are uniform.

➢ In variable pre-fetch, the storage system pre-fetches an amount of data in multiples of the size 

of the host request.


Write Operation with Cache - 


➢ Write operations with cache provide performance advantages over writing directly to 

disks.

➢ When an I/O is written to cache and acknowledged, it is completed in far less time (from 

the host’s perspective) than it would take to write directly to disk.

➢ Sequential writes also offer opportunities for optimization because many smaller writes 

can be coalesced for larger transfers to disk drives with the use of cache.

➢ A write operation with cache is implemented in the following ways:

➢ Write-back cache: Data is placed in cache and an acknowledgment is sent to the host 

immediately. Later, data from several writes are committed to the disk. Write response 

times are much faster, as the write operations are isolated from the mechanical delays of 

the disk. However, uncommitted data is at risk of loss in the event of cache failures.

➢ Write-through cache: Data is placed in the cache and immediately written to the disk, 

and an acknowledgment is sent to the host. Because data is committed to disk as it arrives,

the risks of data loss are low but write response time is longer because of the disk 

operations.

➢ Cache can be bypassed under certain conditions, such as large size write I/O.

➢ In this implementation, if the size of an I/O request exceeds the predefined size, called 

write aside size, writes are sent to the disk directly to reduce the impact of large writes 

consuming a large cache space.

➢ This is useful in an environment where cache resources are constrained and cache is 

required for small random I/Os.


Write a short note on virtualization provisioning.

Virtual Storage Provisioning

➢ Virtual provisioning enables creating and presenting a LUN with more capacity than 

is physically allocated to it on the storage array.

➢ The LUN created using virtual provisioning is called a thin LUN to distinguish it 

from the traditional LUN.

➢ Thin LUNs do not require physical storage to be completely allocated to them at the 

time they are created and presented to a host.

➢ Physical storage is allocated to the host “on-demand” from a shared pool of physical 

capacity.

➢ A shared pool consists of physical disks.

➢ A shared pool in virtual provisioning is analogous to a RAID group, which is a 

collection of drives on which LUNs are created.

➢ Similar to a RAID group, a shared pool supports a single RAID protection level. 

However, unlike a RAID group, a shared pool might contain large numbers of drives.

➢ Shared pools can be homogeneous (containing a single drive type) or heterogeneous 

(containing mixed drive types, such as flash, FC, SAS, and SATA drives).

➢ Virtual provisioning enables more efficient allocation of storage to hosts.

➢ Virtual provisioning also enables oversubscription, where more capacity is presented 

to the hosts than is actually available on the storage array.

➢ Both shared pool and thin LUN can be expanded non-disruptively as the storage 

requirements of the hosts grow.

➢ Multiple shared pools can be created within a storage array, and a shared pool may be 

shared by multiple thin LUNs.

Explain 3 FC Basic connectivity?

The FC architecture supports three basic interconnectivity options:


1) Point-To-point,

2) Arbitrated Loop (Fc-AL),

3) FC Switched Fabric

Point-to-Point


Point-to-point is the simplest FC configuration — two devices are connected directly to 

each other, as shown in Fig.


➢ This configuration provides a dedicated connection for data transmission between nodes.

➢ The point-to-point configuration offers limited connectivity, as only two devices can 

communicate with each other at a given time.

➢ It cannot be scaled to accommodate a large number of network devices. Standard DAS uses 

point to- point connectivity.


Fibre Channel Arbitrated Loop

➢ In the FC-AL configuration, devices are attached to a shared loop, as shown in Fig 2.5.

➢ FC-AL has the characteristics of a token ring topology and a physical star topology.

➢ In FC-AL, each device contends with other devices to perform I/O operations. Devices on 

the loop must “arbitrate” to gain control of the loop.

➢ At any given time, only one device can perform I/O operations on the loop.

➢ FC-AL implementations may also use hubs whereby the arbitrated loop is physically 

connected in a star topology.

The FC-AL configuration has the following limitations in terms of scalability:

➢ FC-AL shares the bandwidth in the loop.

➢ Only one device can perform I/O operations at a time. Because each device in a loop 

has to wait for its turn to process an I/O request, the speed of data transmission is 

low in an FC-AL topology.

➢FC-AL uses 8-bit addressing. It can support up to 127 devices on a loop.

➢Adding or removing a device results in loop re-initialization, which can 

cause a momentary pause in loop traffic.


Fibre Channel Switched Fabric(FC-SW)

➢ FC-SW provides dedicated data path and scalability.

➢ The addition and removal of a device does not affect the on-going traffic between other 

devices.

➢ FC-SW is referred to as Fabric connect.

➢ A Fabric is a logical space in which all nodes communicate with one another in a network. 

This virtual space can be created with a switch or a network of switches.

➢ Each switch in a fabric contains a a unique domain identifier, which is part of the fabric’s 

addressing scheme.

➢ In a switched fabric, the link between any two switches is called an Interswitch link (ISL). 

➢ ISLs enable switches to be connected together to form a single, larger fabric. 

➢ ISLs are used to transfer host-to-storage data and fabric management traffic from one switch to 

another. 

➢ By using ISLs, a switched fabric can be expanded to connect a large number of nodes.

➢ A Fabric may contain tiers.

➢ The number of tiers in a fabric is based on the number of switches between two points that 

are farthest from each other.

With neat diagram explain fiber channel architecture?

Fibre Channel Architecture:-

➢ Connections in a SAN are accomplished using FC.
➢ Fibre Channel Protocol (FCP) is the implementation of serial SCSI-3 over an FC 
network. In the FCP architecture, all external and remote storage devices attached to the 
SAN appear as local devices to the host operating system.
➢ The key advantages of FCP are as follows:
➢ Sustained transmission bandwidth over long distances.
➢ Support for a larger number of addressable devices over a network.
➢ Theoretically, FC can support over 15 million device addresses on a network.
➢ Exhibits the characteristics of channel transport and provides speeds up to 8.5 
Gb/s (8 GFC).

Fibre Channel Protocol Stack
➢ It is easier to understand a communication protocol by viewing it as a structure of 
independent layers.
➢ FCP defines the communication protocol in five layers:FC-0 through FC-4 (except FC-3 
layer, which is not implemented).
➢ In a layered communication model, the peer layers on each node talk to each other 
through defined protocols.
➢ Fig 2.9 illustrates the fibre channel protocol stack.

➢ FC-4 Upper Layer Protocol
➢ FC-4 is the uppermost layer in the FCP stack.
➢ This layer defines the application interfaces and the way Upper Layer Protocols 
(ULPs) are mapped to the lower FC layers.
➢ The FC standard defines several protocols that can operate on the FC-4 layer (see 
Fig 2.9). Some of the protocols include SCSI, HIPPI Framing Protocol, Enterprise 
Storage Connectivity (ESCON), ATM, and IP.
➢ FC-2 Transport Layer
➢ The FC-2 is the transport layer that contains the payload, addresses of the source 
and destination ports, and link control information.
➢ The FC-2 layer provides Fibre Channel addressing, structure, and organization 
of data (frames,sequences, and exchanges). It also defines fabric services, 
classes of service,flow control, and routing.
➢ FC-1 Transmission Protocol
➢ This layer defines the transmission protocol that includes serial encoding and 
decoding rules, special characters used, and error control.
➢ At the transmitter node, an 8-bit character is encoded into a 10-bit transmissions 
character.
➢ This character is then transmitted to the receiver node.
➢ At the receiver node, the 10-bit character is passed to the FC-1 layer, which 
decodes the 10-bit character into the original 8-bit character.
➢ FC-0 Physical Interface
➢ FC-0 is the lowest layer in the FCP stack.
➢ This layer defines the physical interface, media, and transmission of raw bits.
➢ The FC-0 specification includes cables, connectors, and optical and electrical 
parameters for a variety of data rates.
➢ The FC transmission can use both electrical and optical media.

What is IOT ? Explain components in IoT.

Internet of Things (IoT) is an ecosystem of connected physical objects that are accessible through the Internet (formal definition). So, in simple terms IOT means anything that can be connected to internet and can controlled / monitored using internet from our smart devices or PCs. The “things” specified here can be anything from small tracking chips to actual smart cars on road all these can be categorized as IOT. All things that are connected to internet are assigned with ip to it so that it can be monitored uniquely using internet. The embedded systems and technology are the objects that help in realization of successful IOT. Major Components of IOT: Things or Device - These are fitted with sensors and actuators. Sensors collect data from the environment and give to gateway where as actuators perform the action (as directed after processing of data). Gateway - The sensors give data to Gateway and here some kind pre-processing of data is even done.It also acts as a level of security for the network and for the transmitted data. Cloud - The datas after being collected at is uploaded to cloud. Cloud in simple terms is basically a set of servers connected to internet 24*7. Analytics - The data after being received in the cloud processing is done . Various algorithms are applied here for proper analysis of data .(techniques like Machine Learning etc are even applied) User Interface - User end application where user can monitor or control the data.

Explain in detail the communication network layer. Illustrate the various access technologies with respect to distances.

Communications Network Layer - Once you have determined the influence of the smart object form factor over its transmission capabilities (transmission range, data volume and frequency, sensor density and mobility), you are ready to connect the object and communicate. Compute and network assets used in IoT can be very different from those in IT environments. The difference in the physical form factors between devices used by IT and OT is obvious even to the most casual of observers. What typically drives this is the physical environment in which the devices are deployed. What may not be as inherently obvious, however, is their operational differences. The operational differences must be understood in order to apply the correct handling to secure the target assets. Access Network Sublayer - There is a direct relationship between the IoT network technology you choose and the type of connectivity topology this technology allows. Each technology was designed with a certain number of use cases in mind (what to connect, where to connect, how much data to transport at what interval and over what distance). These use cases determined the frequency band that was expected to be most suitable, the frame structure matching the expected data pattern (packet size and communication intervals), and the possible topologies that these use cases illustrate. One key parameter determining the choice of access technology is the range between the smart object and the information collector. Figure 2-9 lists some access technologies you may encounter in the IoT world and the expected transmission distances.  Range estimates are grouped by category names that illustrate the environment or the vertical where data collection over that range is expected. Common groups are as follows: * PAN (personal area network): Scale of a few meters. This is the personal space around a person. A common wireless technology for this scale is Bluetooth. * HAN (home area network): Scale of a few tens of meters. At this scale, common wireless technologies for IoT include ZigBee and Bluetooth Low Energy (BLE). * NAN (neighborhood area network): Scale of a few hundreds of meters. The term NAN is often used to refer to a group of house units from which data is collected. * FAN (field area network): Scale of several tens of meters to several hundred meters. FAN typically refers to an outdoor area larger than a single group of house units. The FAN is often seen as “open space” (and therefore not secured and not controlled). * LAN (local area network): Scale of up to 100 m. This term is very common in networking, and it is therefore also commonly used in the IoT space when standard networking technologies (such as Ethernet or IEEE 802.11) are used. Similar ranges also do not mean similar topologies. Some technologies offer flexible connectivity structure to extend communication possibilities: Point-to-point topologies Point-to-multipoint

Explain oneM2M IoT Standardized Architecture with a neat diagram.

The oneM2M IoT Standardized Architecture In an effort to standardize the rapidly growing field of machine-to-machine (M2M) communications, the European Telecommunications Standards Institute (ETSI) created the M2M Technical Committee in 2008. The goal of this committee was to create a common architecture that would help accelerate the adoption of M2M applications and devices. Over time, the scope has expanded to include the Internet of Things. One of the greatest challenges in designing an IoT architecture is dealing with the heterogeneity of devices, software, and access methods. By developing a horizontal platform architecture, oneM2M is developing standards that allow interoperability at all levels of the IoT stack. The oneM2M architecture divides IoT functions into three major domains: the application layer, the services layer, and the network layer  Applications layer: The oneM2M architecture gives major attention to connectivity between devices and their applications. This domain includes the application-layer protocols and attempts to standardize northbound API definitions for interaction with business intelligence (BI) systems. Applications tend to be industry-specific and have their own sets of data models, and thus they are shown as vertical entities.  Services layer: This layer is shown as a horizontal framework across the vertical industry applications. At this layer, horizontal modules include the physical network that the IoT applications run on, the underlying management protocols, and the hardware. Examples include backhaul communications via cellular, MPLS networks, VPNs, and so on. Riding on top is the common services layer.  Network layer: This is the communication domain for the IoT devices and endpoints. It includes the devices themselves and the communications network that links them. Embodiments of this communications infrastructure include wireless mesh technologies, such as IEEE 802.15.4, and wireless point-to-multipoint systems, such as IEEE 801.11ah.

Print the spiral order matrix as output for a given matrix of numbers.

import java.util.*;


public class Arrays {

   public static void main(String args[]) {

      Scanner sc = new Scanner(System.in);

      int n = sc.nextInt();

      int m = sc.nextInt();


      int matrix[][] = new int[n][m];

      for(int i=0; i

           for(int j=0; j

               matrix[i][j] = sc.nextInt();

           }

      }


      System.out.println("The Spiral Order Matrix is : ");

      int rowStart = 0;

      int rowEnd = n-1;

      int colStart = 0;

      int colEnd = m-1;


      //To print spiral order matrix

      while(rowStart <= rowEnd && colStart <= colEnd) {

          //1

          for(int col=colStart; col<=colEnd; col++) {

              System.out.print(matrix[rowStart][col] + " ");

          }

          rowStart++;


          //2

          for(int row=rowStart; row<=rowEnd; row++) {

              System.out.print(matrix[row][colEnd] +" ");

          }

          colEnd--;


          //3

          for(int col=colEnd; col>=colStart; col--) {

              System.out.print(matrix[rowEnd][col] + " ");

          }

          rowEnd--;


          //4

          for(int row=rowEnd; row>=rowStart; row--) {

              System.out.print(matrix[row][colStart] + " ");

          }

          colStart++;


          System.out.println();

      }

   }

}

Input an email from the user. You have to create a username from the email by deleting the part that comes after ‘@’. Display that username to the user.

Example : 

email = “mejona@gmail.com” ; username = “mejona” 

email = “helloWorld123@gmail.com”; username = “helloWorld123”

import java.util.*;


public class Strings {

   public static void main(String args[]) {

     Scanner sc = new Scanner (System.in);

     String email = sc.next();

     String userName = "";


     for(int i=0; i

       if(email.charAt(i) == '@') {

        break;

       } else {

         userName += email.charAt(i);

       }

     }


     System.out.println(userName);

   }

}

What is computer graphics and its applications?

Computer graphics deals with generating images with the aid of computers. Today, computer graphics is a core technology in digital photography, film, video games, cell phone and computer displays, and many specialized applications. A great deal of specialized hardware and software has been developed, with the displays of most devices being driven by computer graphics hardware. It is a vast and recently developed area of computer science.

Applications -


  1. Computer Art:
    Using computer graphics we can create fine and commercial art which include animation packages, paint packages. These packages provide facilities for designing object shapes and specifying object motion.Cartoon drawing, paintings, logo design can also be done.


  2. Computer Aided Drawing:
    Designing of buildings, automobile, aircraft is done with the help of computer aided drawing, this helps in providing minute details to the drawing and producing more accurate and sharp drawings with better specifications.


  3. Presentation Graphics:
    For the preparation of reports or summarising the financial, statistical, mathematical, scientific, economic data for research reports, managerial reports, moreover creation of bar graphs, pie charts, time chart, can be done using the tools present in computer graphics.


  4. Entertainment:
    Computer graphics finds a major part of its utility in the movie industry and game industry. Used for creating motion pictures , music video, television shows, cartoon animation films. In the game industry where focus and interactivity are the key players, computer graphics helps in providing such features in the efficient way.


  5. Education:
    Computer generated models are extremely useful for teaching huge number of concepts and fundamentals in an easy to understand and learn manner. Using computer graphics many educational models can be created through which more interest can be generated among the students regarding the subject.


  6. Training:
    Specialised system for training like simulators can be used for training the candidates in a way that can be grasped in a short span of time with better understanding. Creation of training modules using computer graphics is simple and very useful.


  7. Visualisation:
    Today the need of visualise things have increased drastically, the need of visualisation can be seen in many advance technologies , data visualisation helps in finding insights of the data , to check and study the behaviour of processes around us we need appropriate visualisation which can be achieved through proper usage of computer graphics
  8. Image Processing:
    Various kinds of photographs or images require editing in order to be used in different places. Processing of existing images into refined ones for better interpretation is one of the many applications of computer graphics.


  9. Machine Drawing:
    Computer graphics is very frequently used for designing, modifying and creation of various parts of machine and the whole machine itself, the main reason behind using computer graphics for this purpose is the precision and clarity we get from such drawing is ultimate and extremely desired for the safe manufacturing of machine using these drawings.


  10. Graphical User Interface:
    The use of pictures, images, icons, pop-up menus, graphical objects helps in creating a user friendly environment where working is easy and pleasant, using computer graphics we can create such an atmosphere where everything can be automated and anyone can get the desired action performed in an easy fashion.

Explain the basic operation of CRT with its primary components with a neat diagram?

Cathode Ray Tube (CRT):

CRT stands for Cathode Ray Tube. CRT is a technology used in traditional computer monitors and televisions. The image on CRT display is created by firing electrons from the back of the tube of phosphorus located towards the front of the screen.

Once the electron heats the phosphorus, they light up, and they are projected on a screen. The color you view on the screen is produced by a blend of red, blue and green light.

Main Components of CRT are:-

1. Electron Gun: Electron gun consisting of a series of elements, primarily a heating filament (heater) and a cathode. The electron gun creates a source of electrons which are focused into a narrow beam directed at the face of the CRT.

2. Control Electrode: It is used to turn the electron beam on and off.

3. Focusing system: It is used to create a clear picture by focusing the electrons into a narrow beam.

4. Deflection Yoke: It is used to control the direction of the electron beam. It creates an electric or magnetic field which will bend the electron beam as it passes through the area. In a conventional CRT, the yoke is linked to a sweep or scan generator. The deflection yoke which is connected to the sweep generator creates a fluctuating electric or magnetic potential.

5. Phosphorus-coated screen: The inside front surface of every CRT is coated with phosphors. Phosphors glow when a high-energy electron beam hits them. Phosphorescence is the term used to characterize the light given off by a phosphor after it has been exposed to an electron beam.

With a neat diagram explain basic operational concepts of computer?

BASIC OPERATIONAL CONCEPTS - 

• The processor contains ALU, control-circuitry and many registers.

• The instruction-register(IR) holds the instruction that is currently being executed.

• The instruction is then passed to the control-unit, which generates the timing-signals that determine when a given action is to take place

• The PC(Program Counter) contains the memory-address of the next-instruction to be fetched & executed.

• During the execution of an instruction, the contents of PC are updated to point to next instruction.

• The processor also contains „n‟ general-purpose registers R0 through Rn-1.

• The MAR (Memory Address Register) holds the address of the memory-location to be accessed.

• The MDR (Memory Data Register) contains the data to be written into or read out of the addressed location.

Following are the steps that take place to execute an instruction -

• The address of first instruction(to be executed) gets loaded into PC.

• The contents of PC(i.e. address) are transferred to the MAR & control-unit issues Read signal to memory.

• After certain amount of elapsed time, the first instruction is read out of memory and placed into MDR.

• Next, the contents of MDR are transferred to IR. At this point, the instruction can be decoded & executed.

• To fetch an operand, it's address is placed into MAR & control-unit issues Read signal. As a result, the operand is transferred from memory into MDR, and then it is transferred from MDR to ALU.

• Likewise required number of operands is fetched into processor.

• Finally, ALU performs the desired operation.

• If the result of this operation is to be stored in the memory, then the result is sent to the MDR.

• The address of the location where the result is to be stored is sent to the MAR and a Write cycle is initiated.

• At some point during execution, contents of PC are incremented to point to next instruction in the program. [The instruction is a combination of opcode and operand].

What is an addressing mode? Explain different types of addressing mode with ex.

The addressing mode is the method to specify the operand of an instruction. The job of a microprocessor is to execute a set of instructions stored in memory to perform a specific task. Operations require the following:

  1. The operator or opcode which determines what will be done
  2. The operands which define the data to be used in the operation

For example, if we wanted to add the numbers 1 and 2 and get a result, mathematically we would likely write this as 1 + 2. In this case, our operator is (+), or the addition, and our operands are the numbers 1 and 2.

In a microprocessor, the machine needs to be told how to get the operands to perform the operation. The effective address is a term that describes the address of an operand that is stored in memory. There are several methods to designate the effective address of those operands or get them directly from the register. These methods are known as addressing modes.

Types of Addressing Modes

1. Immediate

With immediate addressing mode, the actual data to be used as the operand is included in the instruction itself. Let's say we want to store operand 1 into a register and then add operand 2. With immediate addressing mode, the data values 1 and 2 would be part of the instruction itself as shown below.

2. Direct Addressing

When using direct addressing mode, the address of the operand is specified in the instruction. The processor will retrieve the data directly from the address specified in the instruction. In this figure, the example shows how the instruction tells the processor where to get the data from in memory. The variable addr_of_2 is a pointer to the effective address of the operand.

There are no calculations required to retrieve the operand since the effective address (the address of the operand) is addressed directly. Like immediate addressing mode, the operand is limited to the size of 1 word (8 or 16 bits).

3. Register Addressing

Register addressing mode indicates the operand data is stored in the register itself, so the instruction contains the address of the register. The data would be retrieved from the register.

Define BUS arbitration. With a neat diagram, explain different bus arbitration mechanism

BUS ARBITRATION - 

• The device that is allowed to initiate data transfers on bus at any given time is called bus-master.

• There can be only one bus master at any given time.

• Bus arbitration is the process by which next device to become the bus-master is selected and bus-mastership is transferred to it.

• There are 2 approaches to bus arbitration:

1) In centralized arbitration, a single bus-arbiter performs the required arbitration.

2) In distributed arbitration, all device participate in selection of next bus-master.

CENTRALIZED ARBITRATION -

• A single bus-arbiter performs the required arbitration (Figure: 4.20 & 4.21).

• Normally, processor is the bus. master unless it grants bus mastership to one of the DMA controllers.

• A DMA controller indicates that it needs to become busmaster by activating Bus-Request line(BR).

• The signal on the BR line is the logical OR of bus-requests from all devices connected to it.

• When BR is activated, processor activates Bus-Grant signal(BG1) indicating to DMA controllers that they may use bus when it becomes free. (This signal is connected to all DMA controllers using a daisy-chain arrangement). • If DMA controller-1 is requesting the bus, it blocks propagation of grant-signal to other devices. Otherwise, it passes the grant downstream by asserting BG2.

• Current bus-master indicates to all devices that it is using bus by activating Bus-Busy line (BBSY).

• Arbiter circuit ensures that only one request is granted at any given time according to a predefined priority scheme

A conflict may arise if both the processor and a DMA controller try to use the bus at the same time to access the main memory. To resolve these conflicts, a special circuit called the bus arbiter is provided to coordinate the activities of all devices requesting memory transfers.

DISTRIBUTED ARBITRATION -

• All device participate in the selection of next bus-master (Figure 4.22)

• Each device on bus is assigned a 4-bit identification number (ID).

• When 1 or more devices request bus, they → assert Start-Arbitration signal & → place their 4-bit ID numbers on four open-collector lines ARB 0 through ARB 3 .

• A winner is selected as a result of interaction among signals transmitted over these lines by all contenders.

• Net outcome is that the code on 4 lines represents request that has the highest ID number.

• Main advantage: This approach offers higher reliability since operation of bus is not dependent on any single device.

Structure and Operation of USB(do read USB protocols and architecture

USB  Universal Serial Bus (USB) is an industry standard developed through a collaborative effort of several computer and communication companies, including Compaq, Hewlett-Packard, Intel, Lucent, Microsoft, Nortel Networks, and Philips.

 Speed -

 Low-speed(1.5 Mb/s)

 Full-speed(12 Mb/s)

 High-speed(480 Mb/s)

 Port Limitation

 Device Characteristics

 Plug-and-play USB TREE STRUCTURE 

 To accommodate a large number of devices that can be added or removed at any time, the USB has the tree structure as shown in the figure.

 Each node of the tree has a device called a hub, which acts as an intermediate control point between the host and the I/O devices. At the root of the tree, a root hub connects the entire tree to the host computer. The leaves of the tree are the I/O devices being served (for example, keyboard, Internet connection, speaker, or digital TV)

 In normal operation, a hub copies a message that it receives from its upstream connection to all its downstream ports. As a result, a message sent by the host computer is broadcast to all I/O devices, but only the addressed device will respond to that message. However, a message from an I/O device is sent only upstream towards the root of the tree and is not seen by other devices. Hence, the USB enables the host to communicate with the I/O devices, but it does not enable these devices to communicate with each other.

 When a USB is connected to a host computer, its root hub is attached to the processor bus, where it appears as a single device. The host software communicates with individualdevices attached to the USB by sending packets of information, which the root hub forwards to the appropriate device in the USB tree.

 Each device on the USB, whether it is a hub or an I/O device, is assigned a 7-bit address. This address is local to the USB tree and is not related in any way to the addresses used on the processor bus.

 A hub may have any number of devices or other hubs connected to it, and addresses are assigned arbitrarily. When a device is first connected to a hub, or when it is powered on, it has the address 0. The hardware of the hub to which this device is connected is capable of detecting that the device has been connected, and it records this fact as part of its own status information. Periodically, the host polls each hub to collect status information and learn about new devices that may have been added or disconnected.

 When the host is informed that a new device has been connected, it uses a sequence of commands to send a reset signal on the corresponding hub port, read information from the device about its capabilities, send configuration information to the device, and assign the device a unique USB address. Once this sequence is completed the device begins normal operation and responds only to the new address. USB protocols

 All information transferred over the USB is organized in packets, where a packet consists of one or more bytes of information. There are many types of packets that perform a variety of control functions.

 The information transferred on the USB can be divided into two broad categories: control and data.

 Control packets perform such tasks as addressing a device to initiate data transfer, acknowledging that data have been received correctly, or indicating an error.  Data packets carry information that is delivered to a device.  A packet consists of one or more fields containing different kinds of information. The first field of any packet is called the packet identifier, PID, which identifies the type of that packet.  They are transmitted twice. The first time they are sent with their true values, and the second time with each bit complemented

 The four PID bits identify one of 16 different packet types. Some control packets, such as ACK (Acknowledge), consist only of the PID byte.

ELECTRICAL CHARACTERISTICS

 The cables used for USB connections consist of four wires.

 Two are used to carry power, +5V and Ground.

 Thus, a hub or an I/O device may be powered directly from the bus, or it may have its own external power connection.

 The other two wires are used to carry data.

 Different signaling schemes are used for different speeds of transmission.

 At low speed, 1s and 0s are transmitted by sending a high voltage state (5V) on one or the other o the two signal wires. For high-speed links, differential transmission is used.

What are the classification of energy resources?

1. Based on usability of energy:

a) Primary resources:

Resources available in nature in raw form is called primary energy resources. Ex: Fossil fuels (coal, oil & gas), uranium, hydro energy. These are also known as raw energy resources.

b) Intermediate resources: This is obtained from primary energy resources by one or more steps of transformation & is used as a vehicle of energy.

c) Secondary resources: The form of energy, which is finally supplied to consume for utilization. Ex: electrical energy, thermal energy (in the form of steam or hot water), chemical energy (in the form of hydrogen or fossil fuels). Some form of energies may be classified as both intermediate as well as secondary sources. Ex: electricity, hydrogen.

2. Based on traditional use:

a) Conventional: Energy resources which have been traditionally used for many decades. Ex: fossil fuels, nuclear & hydro resources

b) Non-conventional: Energy resources which are considered for large scale & renewable. Ex : solar, wind & bio-mass

3. Based on term availability:

a) Non-renewable resources: resources which are finited, & do not get replenished after their consumption. Ex : fossil fuels, uranium

b) Renewable resources: resources which are renewed by nature again & again & their supply are not affected by the rate of their consumption. Ex : solar, wind, biomass, ocean ( thermal, tidal & wave), geothermal, hydro

4. Based on commercial application:

a) Commercial energy resources: the secondary useable energy forms such as electricity, petrol, and diesel are essential for commercial activities. The economy of a country depends on its ability to convert natural raw energy into commercial energy. Ex : coal, oil, gas, uranium, & hydro

b) Non-commercial energy resources: the energy derived from nature & used – directly without passing through commercial outlet. Ex: wood, animal dung cake, crop residue.

5. Based on origin:

a) Fossil fuels energy     f) bio-mass energy

b) Nuclear energy          g) geothermal energy

c) Hydro energy             h) tidal energy

d) Solar energy               i) ocean thermal energy

e) Wind energy               j) ocean wave energy

What is grid computing? List and explain the features, drawbacks of grid computing.

Grid Computing

Features of Grid Computing:

  • Resource sharing: Grid computing facilitates the sharing of computing resources, including processing power, storage capacity, and software applications, among multiple users and organizations.
  • Scalability: Grid computing provides scalability by allowing additional resources to be easily added or removed from the grid as per the demand.
  • Collaboration: Grid computing promotes collaboration among different organizations or research groups. It enables them to share data, tools, and expertise, leading to enhanced research capabilities and faster discovery.
  • Fault tolerance: Grid computing systems are designed to be resilient and fault-tolerant. If a node or resource fails, the workload can be automatically rerouted to another available resource, ensuring minimal disruption and downtime.
  • Heterogeneity: Grid computing supports the integration of diverse computing resources and platforms, including different operating systems, hardware architectures, and software stacks.

Drawbacks of Grid Computing:

  • Complexity: Setting up and managing a grid computing infrastructure can be complex and require specialized skills.
  • Security and privacy: Grid computing involves sharing resources across multiple organizations, which introduces security and privacy concerns.
  • Performance variability: Grid computing relies on resources that may have varying capabilities, network latencies, and bandwidth limitations.
  • Interoperability: Achieving interoperability between different software platforms, tools, and applications within a grid environment can be challenging.

Big Data Analytics

Key aspects of Big Data Analytics:

  1. Data collection and storage: Big Data analytics requires collecting, storing, and managing massive volumes of data from various sources.
  2. Data preprocessing: Before analysis, Big Data often requires preprocessing, which involves cleaning, filtering, transforming, and integrating data from different sources.
  3. Data analysis techniques: Big Data analytics employs various techniques such as statistical analysis, data mining, machine learning, natural language processing, and predictive modeling.
  4. Real-time and batch processing: Big Data analytics can be performed in real-time or using batch processing.
  5. Visualization and reporting: The results of Big Data analytics are often visualized and presented in a meaningful way to facilitate understanding and decision-making.